2787 Via Piazza Loop Fort Myers, FL 33905
The Forum NeighborhoodEstimated Value: $522,000 - $606,000
4
Beds
4
Baths
3,849
Sq Ft
$145/Sq Ft
Est. Value
About This Home
This home is located at 2787 Via Piazza Loop, Fort Myers, FL 33905 and is currently estimated at $559,677, approximately $145 per square foot. 2787 Via Piazza Loop is a home located in Lee County with nearby schools including Tice Elementary School, Orange River Elementary School, and Edgewood Academy.
Ownership History
Date
Name
Owned For
Owner Type
Purchase Details
Closed on
Aug 18, 2020
Sold by
Le Loc Tan and Tran Van
Bought by
Le Duc Tan and Le Tammy
Current Estimated Value
Purchase Details
Closed on
Jan 9, 2014
Sold by
Le Loc Tan
Bought by
Le Loc Tan and Le Tammy
Purchase Details
Closed on
May 27, 2011
Sold by
Bracero Joseph L and Bracero Mildred S
Bought by
Le Loc T
Home Financials for this Owner
Home Financials are based on the most recent Mortgage that was taken out on this home.
Original Mortgage
$142,800
Interest Rate
4.79%
Mortgage Type
New Conventional
Purchase Details
Closed on
Jun 4, 2007
Sold by
The Ryland Group Inc
Bought by
Bracero Joseph L and Bracero Mildred S
Home Financials for this Owner
Home Financials are based on the most recent Mortgage that was taken out on this home.
Original Mortgage
$401,600
Interest Rate
5.75%
Mortgage Type
Unknown
Create a Home Valuation Report for This Property
The Home Valuation Report is an in-depth analysis detailing your home's value as well as a comparison with similar homes in the area
Home Values in the Area
Average Home Value in this Area
Purchase History
| Date | Buyer | Sale Price | Title Company |
|---|---|---|---|
| Le Duc Tan | $180,000 | Attorney | |
| Le Loc Tan | -- | None Available | |
| Le Loc T | $204,000 | North American Title Company | |
| Bracero Joseph L | $502,000 | Ryland Title Company |
Source: Public Records
Mortgage History
| Date | Status | Borrower | Loan Amount |
|---|---|---|---|
| Previous Owner | Le Loc T | $142,800 | |
| Previous Owner | Bracero Joseph L | $401,600 |
Source: Public Records
Tax History
| Year | Tax Paid | Tax Assessment Tax Assessment Total Assessment is a certain percentage of the fair market value that is determined by local assessors to be the total taxable value of land and additions on the property. | Land | Improvement |
|---|---|---|---|---|
| 2025 | $5,570 | $347,387 | -- | -- |
| 2024 | $5,345 | $337,597 | -- | -- |
| 2023 | $5,345 | $327,764 | $0 | $0 |
| 2022 | $5,314 | $318,217 | $0 | $0 |
| 2021 | $5,413 | $321,729 | $62,350 | $259,379 |
| 2020 | $5,349 | $301,077 | $0 | $0 |
| 2019 | $5,305 | $294,158 | $0 | $0 |
| 2018 | $5,424 | $293,925 | $0 | $0 |
| 2017 | $5,579 | $296,692 | $0 | $0 |
| 2016 | $5,291 | $283,507 | $54,000 | $229,507 |
| 2015 | $5,442 | $296,911 | $52,000 | $244,911 |
| 2014 | -- | $264,795 | $41,000 | $223,795 |
| 2013 | -- | $265,782 | $28,800 | $236,982 |
Source: Public Records
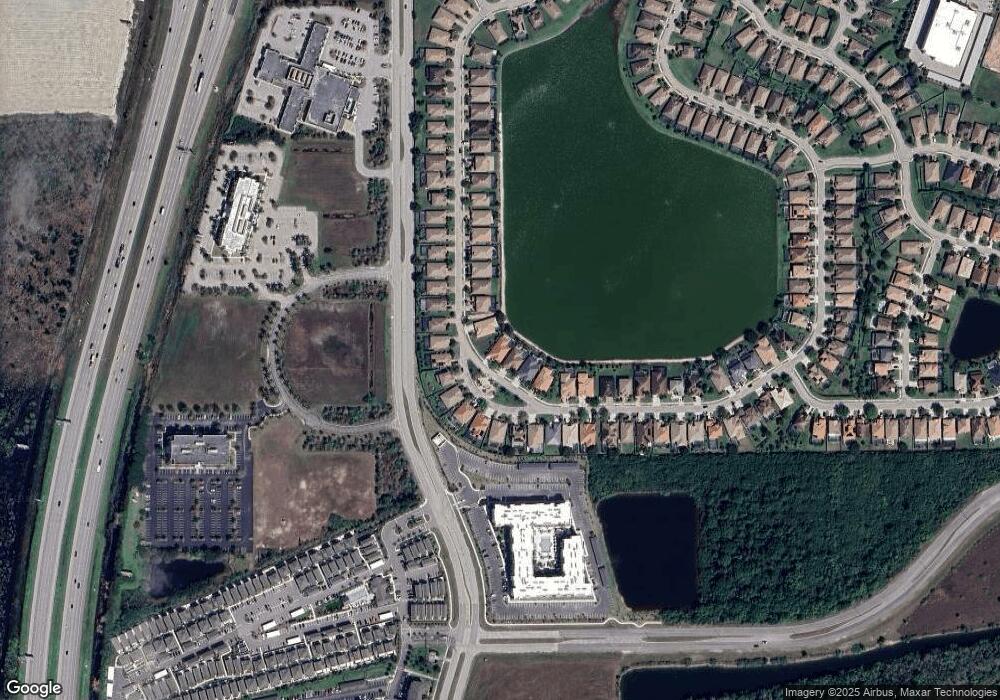
Map
Nearby Homes
- 2792 Via Piazza Loop
- 2798 Via Piazza Loop
- 2772 Via Piazza Loop
- 2769 Via Piazza Loop
- 2822 Via Piazza Loop
- 2738 Via Piazza Loop
- 2858 Via Campania St
- 9918 Via San Marco Loop
- 3185 Antica St
- 3186 Antica St
- 9935 Via San Marco Loop
- 3174 Antica St
- 3223 Antica St
- 3245 Antica St
- 3032 Via Rialto St
- 10027 Salina St
- 3034 Via San Marco Ct
- 10043 Salina St
- 3345 Antica St
- 9999 Chiana Cir
- 2793 Via Piazza Loop
- 2795 Via Piazza Loop
- 2783 Via Piazza Loop
- 2781 Via Piazza Loop
- 2799 Via Piazza Loop
- 2803 Via Piazza Loop
- 2779 Via Piazza Loop
- 2784 Via Piazza Loop
- 2782 Via Piazza Loop
- 2788 Via Piazza Loop
- 2790 Via Piazza Loop
- 2805 Via Piazza Loop
- 2780 Via Piazza Loop
- 2777 Via Piazza Loop
- 2794 Via Piazza Loop
- 2778 Via Piazza Loop
- 2798 Via Piazza Loop Unit 36
- 2800 Via Piazza Loop
- 2775 Via Piazza Loop
- 2802 Via Piazza Loop
Your Personal Tour Guide
Ask me questions while you tour the home.