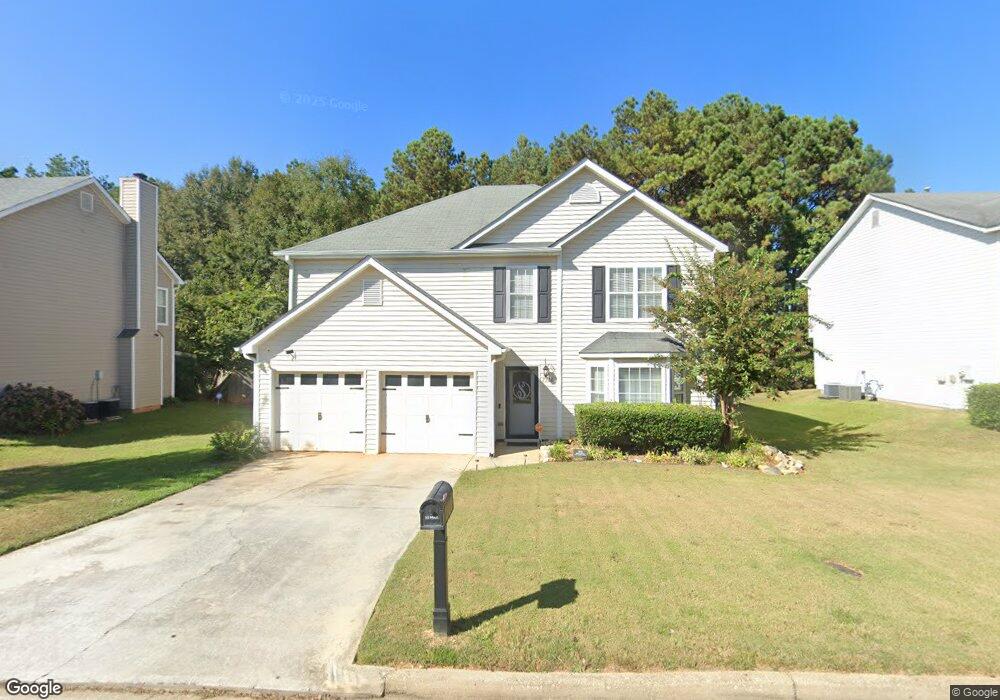
2788 Field Spring Dr Unit 3 Lithonia, GA 30058
Estimated Value: $279,196 - $322,000
3
Beds
3
Baths
2,374
Sq Ft
$128/Sq Ft
Est. Value
About This Home
This home is located at 2788 Field Spring Dr Unit 3, Lithonia, GA 30058 and is currently estimated at $303,549, approximately $127 per square foot. 2788 Field Spring Dr Unit 3 is a home located in DeKalb County with nearby schools including Stoneview Elementary School, Lithonia Middle School, and Lithonia High School.
Ownership History
Date
Name
Owned For
Owner Type
Purchase Details
Closed on
Jul 5, 2001
Sold by
Novastar Mortgage Inc
Bought by
Parker Stephanie B
Current Estimated Value
Home Financials for this Owner
Home Financials are based on the most recent Mortgage that was taken out on this home.
Original Mortgage
$123,950
Outstanding Balance
$47,525
Interest Rate
7.23%
Mortgage Type
New Conventional
Estimated Equity
$256,024
Purchase Details
Closed on
Feb 6, 2001
Sold by
Hodge Lefty
Bought by
Novastar Mortgage Inc
Purchase Details
Closed on
Jul 31, 1998
Sold by
Greenwood Homes Inc
Bought by
Hodge Lefty
Home Financials for this Owner
Home Financials are based on the most recent Mortgage that was taken out on this home.
Original Mortgage
$98,600
Interest Rate
10.75%
Mortgage Type
New Conventional
Create a Home Valuation Report for This Property
The Home Valuation Report is an in-depth analysis detailing your home's value as well as a comparison with similar homes in the area
Home Values in the Area
Average Home Value in this Area
Purchase History
| Date | Buyer | Sale Price | Title Company |
|---|---|---|---|
| Parker Stephanie B | $130,500 | -- | |
| Novastar Mortgage Inc | $121,144 | -- | |
| Hodge Lefty | $116,000 | -- |
Source: Public Records
Mortgage History
| Date | Status | Borrower | Loan Amount |
|---|---|---|---|
| Open | Parker Stephanie B | $123,950 | |
| Previous Owner | Hodge Lefty | $98,600 |
Source: Public Records
Tax History Compared to Growth
Tax History
| Year | Tax Paid | Tax Assessment Tax Assessment Total Assessment is a certain percentage of the fair market value that is determined by local assessors to be the total taxable value of land and additions on the property. | Land | Improvement |
|---|---|---|---|---|
| 2025 | $3,146 | $109,960 | $18,000 | $91,960 |
| 2024 | $3,294 | $113,600 | $18,000 | $95,600 |
| 2023 | $3,294 | $106,280 | $16,200 | $90,080 |
Source: Public Records
Map
Nearby Homes
- 2863 Hillvale Cove Dr
- 2539 Willow Way Dr
- 2485 Field Spring Dr
- 6003 Hillvale Ct Unit 1
- 2396 Hillvale Cir
- 2530 Hillvale Cir
- 6900 Covington Hwy
- 5914 Sutcliff Square
- 2161 Wellington Cir Unit 2161
- 5867 Heritage Walk
- 2173 Wellington Cir
- 2722 Penwood Place
- 6175 Creekford Dr
- 2356 Cove Rd
- 2294 Wellington Cir Unit 2294
- 3026 Sherbourne Cove
- 2623 Wellington Walk Place
- 2621 Wellington Walk Place
- 5918 Crescent Ridge Ct
- 768 Hillandale Ln
- 2794 Field Spring Dr Unit 3
- 2782 Field Spring Dr
- 2776 Field Spring Dr Unit 3
- 2800 Field Spring Dr Unit 3
- 2521 Willow Way Dr Unit 3
- 6095 Brook Hollow Ln Unit 3
- 2783 Field Spring Dr Unit 3
- 2765 Field Spring Dr Unit 3
- 2770 Field Spring Dr Unit 2770
- 2770 Field Spring Dr
- 2770 Field Spring Dr
- 2770 Field Spring Dr
- 6099 Brook Hollow Ln
- 2801 Field Spring Dr
- 2808 Field Spring Dr
- 2527 Willow Way Dr Unit 2
- 6094 Brook Hollow Ln Unit 3
- 2751 Field Spring Dr
- 2809 Field Spring Dr
- 2526 Willow Way Dr