Estimated Value: $587,000 - $788,000
6
Beds
4
Baths
3,739
Sq Ft
$177/Sq Ft
Est. Value
About This Home
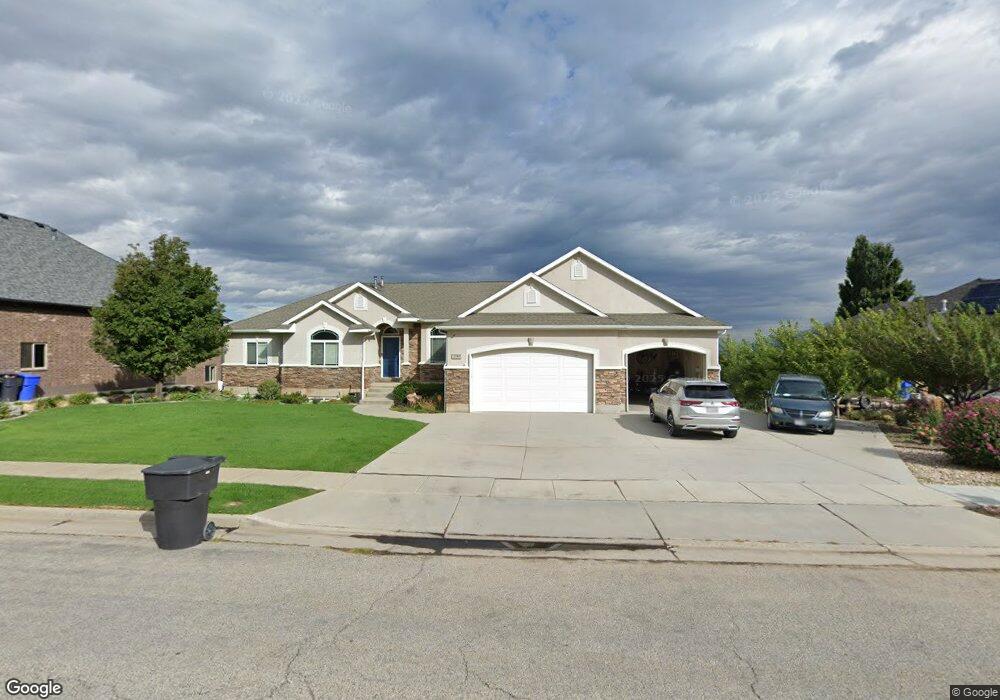
This home is located at 2788 Peach St, Perry, UT 84302 and is currently estimated at $662,393, approximately $177 per square foot. 2788 Peach St is a home located in Box Elder County with nearby schools including Three Mile Creek School, Adele C. Young Intermediate School, and Box Elder Middle School.
Ownership History
Date
Name
Owned For
Owner Type
Purchase Details
Closed on
Sep 26, 2016
Sold by
Arrington Ryan
Bought by
Arrington Ryan W
Current Estimated Value
Home Financials for this Owner
Home Financials are based on the most recent Mortgage that was taken out on this home.
Original Mortgage
$239,750
Outstanding Balance
$192,021
Interest Rate
3.43%
Mortgage Type
New Conventional
Estimated Equity
$470,372
Purchase Details
Closed on
Feb 28, 2014
Sold by
Ashurst Kevin J and Ashurst Vonda M
Bought by
Arrington Ryan
Home Financials for this Owner
Home Financials are based on the most recent Mortgage that was taken out on this home.
Original Mortgage
$244,000
Interest Rate
4.38%
Mortgage Type
New Conventional
Purchase Details
Closed on
May 27, 2011
Sold by
Ashurst Kevin J and Ashurst Vonda M
Bought by
Ashurst Kevin J and Ashurst Vonda M
Home Financials for this Owner
Home Financials are based on the most recent Mortgage that was taken out on this home.
Original Mortgage
$268,500
Interest Rate
4.73%
Mortgage Type
New Conventional
Create a Home Valuation Report for This Property
The Home Valuation Report is an in-depth analysis detailing your home's value as well as a comparison with similar homes in the area
Home Values in the Area
Average Home Value in this Area
Purchase History
| Date | Buyer | Sale Price | Title Company |
|---|---|---|---|
| Arrington Ryan W | -- | North American Title Bontifu | |
| Arrington Ryan | -- | None Available | |
| Ashurst Kevin J | -- | Atlas Title Slat Lake |
Source: Public Records
Mortgage History
| Date | Status | Borrower | Loan Amount |
|---|---|---|---|
| Open | Arrington Ryan W | $239,750 | |
| Closed | Arrington Ryan | $244,000 | |
| Previous Owner | Ashurst Kevin J | $268,500 |
Source: Public Records
Tax History Compared to Growth
Tax History
| Year | Tax Paid | Tax Assessment Tax Assessment Total Assessment is a certain percentage of the fair market value that is determined by local assessors to be the total taxable value of land and additions on the property. | Land | Improvement |
|---|---|---|---|---|
| 2025 | $3,428 | $636,736 | $165,000 | $471,736 |
| 2024 | $3,428 | $598,064 | $160,000 | $438,064 |
| 2023 | $3,458 | $614,933 | $160,000 | $454,933 |
| 2022 | $3,291 | $301,700 | $35,750 | $265,950 |
| 2021 | $2,843 | $356,419 | $65,000 | $291,419 |
| 2020 | $2,475 | $356,419 | $65,000 | $291,419 |
| 2019 | $2,625 | $201,691 | $33,000 | $168,691 |
| 2018 | $2,382 | $179,687 | $33,000 | $146,687 |
| 2017 | $2,596 | $326,704 | $33,000 | $266,704 |
| 2016 | $2,564 | $172,702 | $33,000 | $139,702 |
| 2015 | $2,334 | $160,002 | $33,000 | $127,002 |
| 2014 | $2,334 | $153,954 | $16,005 | $137,949 |
| 2013 | -- | $141,413 | $16,005 | $125,408 |
Source: Public Records
Map
Nearby Homes
- 2548 S 700 W
- 2855 S 1000 W
- 2475 S 450 W
- 2925 S Highway 89 Unit 1
- 2925 S Highway 89 Unit 15
- 2925 S Highway 89 Unit 12
- 2484 S 900 W
- 2975 S 1080 W
- 2280 S 450 W
- 2277 S 525 W
- 2245 S 450 W
- 2230 S 635 W Unit C
- 2230 S 635 W Unit D
- Northfield Plan at West Meadows
- Everley Plan at West Meadows
- Scottsford Plan at West Meadows
- Pembroke Plan at West Meadows
- Hallwood Plan at West Meadows
- Winfield Plan at West Meadows
- Xavier Plan at West Meadows
- 2762 Peach St
- 2808 Peach St
- 2723 S 600 W
- 444 W 2800 S
- 2787 S Peach Dr Unit 103
- 2748 Peach St
- 2748 Peach St
- 2709 S 600 W
- 2767 Peach St
- 575 W 2700 S Unit 80
- 2811 Peach St
- 2811 S 450 W
- 2816 Peach St
- 2816 S 450 W
- 2816 S 450 W Unit 44
- 2740 S 600 W
- 2740 S 600 W Unit 2
- 434 W 2800 S
- 434 W 2800 S Unit 104R
- 437 W 2800 S