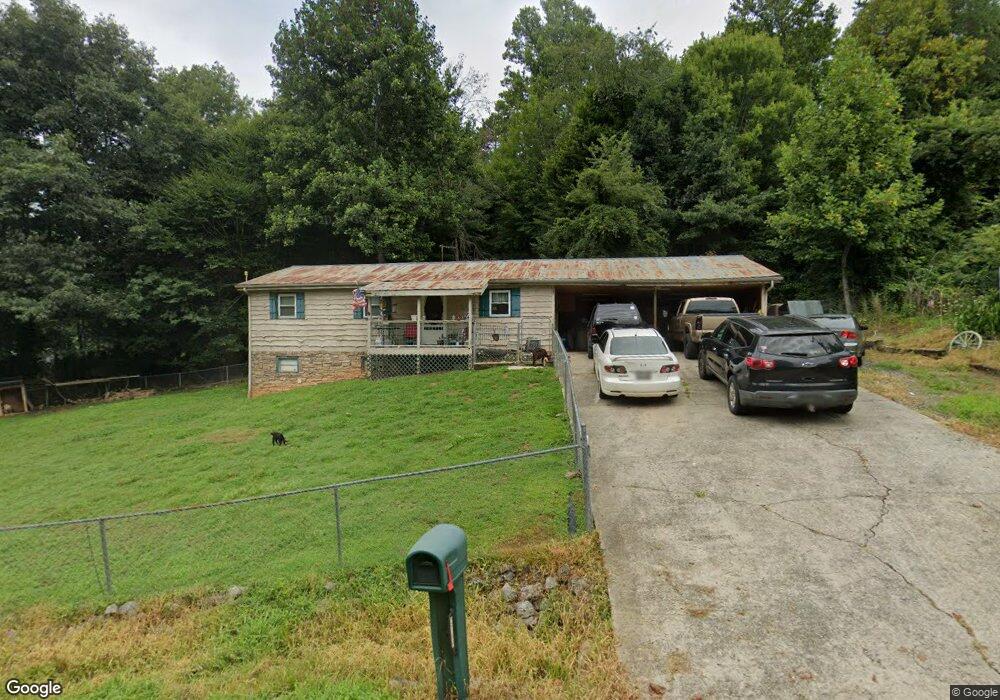
2789 Shewcraft Place Lenoir, NC 28645
Estimated Value: $172,000 - $282,000
2
Beds
2
Baths
972
Sq Ft
$217/Sq Ft
Est. Value
About This Home
This home is located at 2789 Shewcraft Place, Lenoir, NC 28645 and is currently estimated at $211,178, approximately $217 per square foot. 2789 Shewcraft Place is a home located in Caldwell County with nearby schools including Gamewell Elementary School, West Lenoir Elementary School, and Gamewell Middle School.
Ownership History
Date
Name
Owned For
Owner Type
Purchase Details
Closed on
Oct 6, 2014
Sold by
Lowrance Steven D and Lowrance Shannette R
Bought by
Lowrance Steven D
Current Estimated Value
Purchase Details
Closed on
Oct 30, 2008
Sold by
Miller & Company Builders Llc
Bought by
Lowrance Steven D and Lowrance Shannette R
Home Financials for this Owner
Home Financials are based on the most recent Mortgage that was taken out on this home.
Original Mortgage
$68,850
Interest Rate
5.78%
Mortgage Type
Purchase Money Mortgage
Purchase Details
Closed on
Feb 18, 2007
Sold by
Miller Gentry & Mcgee Construction Inc
Bought by
Miller & Company Builders Llc
Purchase Details
Closed on
Oct 21, 2005
Sold by
Citifinancial Services Inc 309 Llc
Bought by
Miller Gentry Mcgee Inc
Purchase Details
Closed on
Sep 20, 2005
Sold by
Darnell Kathy A Triplett and Triplett Kathy A
Bought by
Citifinancial Services Inc
Purchase Details
Closed on
Nov 1, 1994
Purchase Details
Closed on
Jan 1, 1989
Create a Home Valuation Report for This Property
The Home Valuation Report is an in-depth analysis detailing your home's value as well as a comparison with similar homes in the area
Home Values in the Area
Average Home Value in this Area
Purchase History
| Date | Buyer | Sale Price | Title Company |
|---|---|---|---|
| Lowrance Steven D | $68,850 | -- | |
| Lowrance Steven D | $67,500 | Wtc | |
| Miller & Company Builders Llc | -- | None Available | |
| Miller Gentry Mcgee Inc | $30,000 | Wtc | |
| Citifinancial Services Inc | $49,984 | None Available | |
| -- | $38,000 | -- | |
| -- | $2,000 | -- |
Source: Public Records
Mortgage History
| Date | Status | Borrower | Loan Amount |
|---|---|---|---|
| Previous Owner | Lowrance Steven D | $68,850 |
Source: Public Records
Tax History Compared to Growth
Tax History
| Year | Tax Paid | Tax Assessment Tax Assessment Total Assessment is a certain percentage of the fair market value that is determined by local assessors to be the total taxable value of land and additions on the property. | Land | Improvement |
|---|---|---|---|---|
| 2025 | $622 | $158,500 | $17,500 | $141,000 |
| 2024 | $622 | $78,900 | $17,500 | $61,400 |
| 2023 | $591 | $78,900 | $17,500 | $61,400 |
| 2022 | $579 | $78,900 | $17,500 | $61,400 |
| 2021 | $579 | $78,900 | $17,500 | $61,400 |
| 2020 | $545 | $72,600 | $18,000 | $54,600 |
| 2019 | $545 | $72,600 | $18,000 | $54,600 |
| 2018 | $545 | $72,600 | $0 | $0 |
| 2017 | $545 | $72,600 | $0 | $0 |
| 2016 | $544 | $72,600 | $0 | $0 |
| 2015 | $517 | $72,600 | $0 | $0 |
| 2014 | $517 | $72,600 | $0 | $0 |
Source: Public Records
Map
Nearby Homes
- 2783 Shewcraft Place
- 1270 Price Hollow Place
- 1266 Price Hollow Place
- 790 Abington Rd
- 2348 W Lenoir Dr
- 2326 Morganton Blvd SW
- 133 Green Place
- 2308 Morganton Blvd SW
- 2505 Morganton Blvd SW
- 205 Abington Rd NW
- 2636 Cheraw Rd
- 0 Deerbrook Rd
- 3203 Sheely Rd
- 2162 Watson Rd
- 2664 Charles Teague Place
- 931 Emerald Place SW
- 2866 Old Morganton Rd
- 811 Queens St NW
- 811 Queens St
- 1607 Bradford St SW
- 2796 Shewcraft Place
- 2788 Shewcraft Place
- 2784 Shewcraft Place
- 674 Abington Rd
- 2776 Shewcraft Place
- 1351 Shew Hollar Rd
- 683 Abington Rd
- 686 Abington Rd
- 651 Abington Rd
- 1346 Shew Hollar Rd
- 2770 Shewcraft Place
- 1335 Shew Hollar Rd
- 1370 Morrows Place
- 1406 Beecher Anderson Rd
- 2764 Shewcraft Place
- 1329 Shew Hollar Rd
- 1412 Beecher Anderson Rd
- 2759 Shewcraft Place
- 714 Abington Rd
- 1568 Strawberry Way