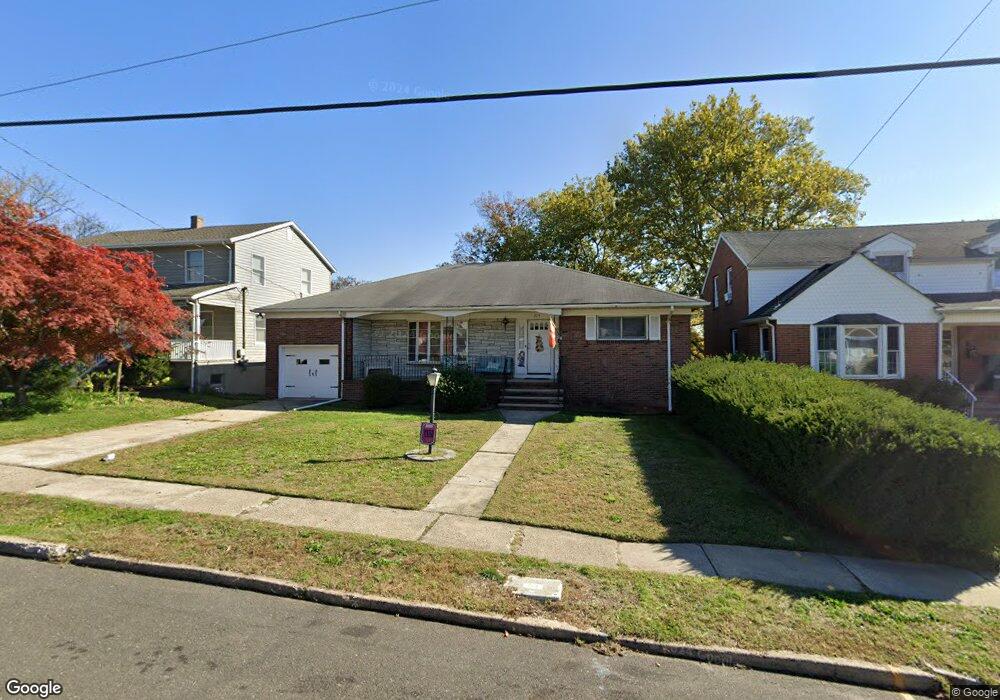
279 4th St South Amboy, NJ 08879
Estimated Value: $532,689 - $637,000
--
Bed
--
Bath
1,565
Sq Ft
$363/Sq Ft
Est. Value
About This Home
This home is located at 279 4th St, South Amboy, NJ 08879 and is currently estimated at $568,422, approximately $363 per square foot. 279 4th St is a home located in Middlesex County with nearby schools including South Amboy Elementary School, South Amboy Middle/High School, and St. Mary Elementary School.
Ownership History
Date
Name
Owned For
Owner Type
Purchase Details
Closed on
Sep 28, 2009
Sold by
Brown Thomas G
Bought by
Anderson Mary
Current Estimated Value
Home Financials for this Owner
Home Financials are based on the most recent Mortgage that was taken out on this home.
Original Mortgage
$239,112
Outstanding Balance
$156,455
Interest Rate
5.12%
Mortgage Type
FHA
Estimated Equity
$411,967
Purchase Details
Closed on
Mar 22, 2001
Sold by
Turnbull Frank
Bought by
Brown Thomas
Home Financials for this Owner
Home Financials are based on the most recent Mortgage that was taken out on this home.
Original Mortgage
$100,000
Interest Rate
6.97%
Create a Home Valuation Report for This Property
The Home Valuation Report is an in-depth analysis detailing your home's value as well as a comparison with similar homes in the area
Home Values in the Area
Average Home Value in this Area
Purchase History
| Date | Buyer | Sale Price | Title Company |
|---|---|---|---|
| Anderson Mary | $331,000 | None Available | |
| Brown Thomas | $189,000 | -- |
Source: Public Records
Mortgage History
| Date | Status | Borrower | Loan Amount |
|---|---|---|---|
| Open | Anderson Mary | $239,112 | |
| Previous Owner | Brown Thomas | $100,000 |
Source: Public Records
Tax History Compared to Growth
Tax History
| Year | Tax Paid | Tax Assessment Tax Assessment Total Assessment is a certain percentage of the fair market value that is determined by local assessors to be the total taxable value of land and additions on the property. | Land | Improvement |
|---|---|---|---|---|
| 2025 | $9,402 | $293,000 | $141,800 | $151,200 |
| 2024 | $9,048 | $293,000 | $141,800 | $151,200 |
| 2023 | $9,048 | $293,000 | $141,800 | $151,200 |
| 2022 | $8,597 | $293,000 | $141,800 | $151,200 |
| 2021 | $8,453 | $293,000 | $141,800 | $151,200 |
| 2020 | $8,254 | $293,000 | $141,800 | $151,200 |
| 2019 | $8,122 | $293,000 | $141,800 | $151,200 |
| 2018 | $8,055 | $293,000 | $141,800 | $151,200 |
| 2017 | $7,926 | $293,000 | $141,800 | $151,200 |
| 2016 | $7,726 | $293,000 | $141,800 | $151,200 |
| 2015 | $7,782 | $293,000 | $141,800 | $151,200 |
| 2014 | $7,515 | $293,000 | $141,800 | $151,200 |
Source: Public Records
Map
Nearby Homes