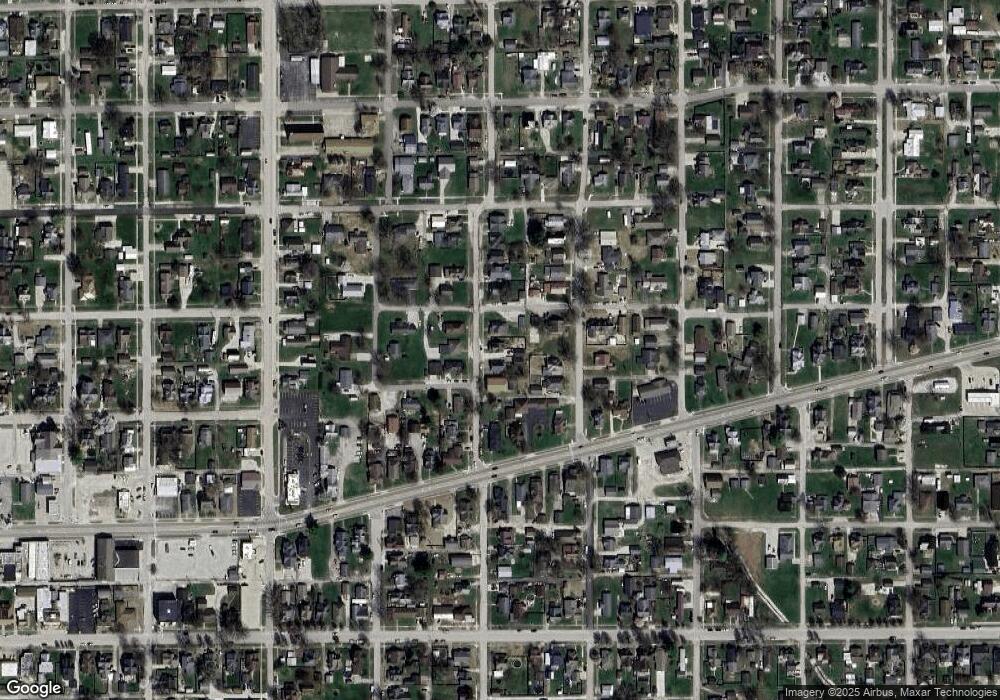
279 6th St NE Linton, IN 47441
Estimated Value: $140,000 - $156,000
--
Bed
2
Baths
1,664
Sq Ft
$88/Sq Ft
Est. Value
About This Home
This home is located at 279 6th St NE, Linton, IN 47441 and is currently estimated at $147,149, approximately $88 per square foot. 279 6th St NE is a home located in Greene County with nearby schools including Linton-Stockton Elementary School, Linton-Stockton Junior High School, and Linton-Stockton High School.
Ownership History
Date
Name
Owned For
Owner Type
Purchase Details
Closed on
Jan 6, 2021
Sold by
Bitter Sherri L
Bought by
Meadows Jeff and Meadows Sandra D
Current Estimated Value
Home Financials for this Owner
Home Financials are based on the most recent Mortgage that was taken out on this home.
Original Mortgage
$107,350
Outstanding Balance
$95,810
Interest Rate
2.71%
Mortgage Type
New Conventional
Estimated Equity
$51,339
Purchase Details
Closed on
Dec 9, 2008
Sold by
Anderson Chadd E and Anderson Sherri L
Bought by
Anderson Sherri L
Create a Home Valuation Report for This Property
The Home Valuation Report is an in-depth analysis detailing your home's value as well as a comparison with similar homes in the area
Home Values in the Area
Average Home Value in this Area
Purchase History
| Date | Buyer | Sale Price | Title Company |
|---|---|---|---|
| Meadows Jeff | -- | None Available | |
| Anderson Sherri L | -- | None Available |
Source: Public Records
Mortgage History
| Date | Status | Borrower | Loan Amount |
|---|---|---|---|
| Open | Meadows Jeff | $107,350 |
Source: Public Records
Tax History Compared to Growth
Tax History
| Year | Tax Paid | Tax Assessment Tax Assessment Total Assessment is a certain percentage of the fair market value that is determined by local assessors to be the total taxable value of land and additions on the property. | Land | Improvement |
|---|---|---|---|---|
| 2024 | $12 | $64,900 | $8,600 | $56,300 |
| 2023 | $12 | $64,100 | $8,600 | $55,500 |
| 2022 | $580 | $66,000 | $8,600 | $57,400 |
| 2021 | $12 | $61,200 | $8,600 | $52,600 |
| 2020 | $529 | $61,200 | $8,600 | $52,600 |
| 2019 | $559 | $61,200 | $8,600 | $52,600 |
| 2018 | $455 | $53,100 | $8,600 | $44,500 |
| 2017 | $437 | $52,700 | $8,600 | $44,100 |
| 2016 | $407 | $51,700 | $8,700 | $43,000 |
| 2014 | $463 | $61,500 | $8,700 | $52,800 |
| 2013 | -- | $60,800 | $8,600 | $52,200 |
Source: Public Records
Map
Nearby Homes