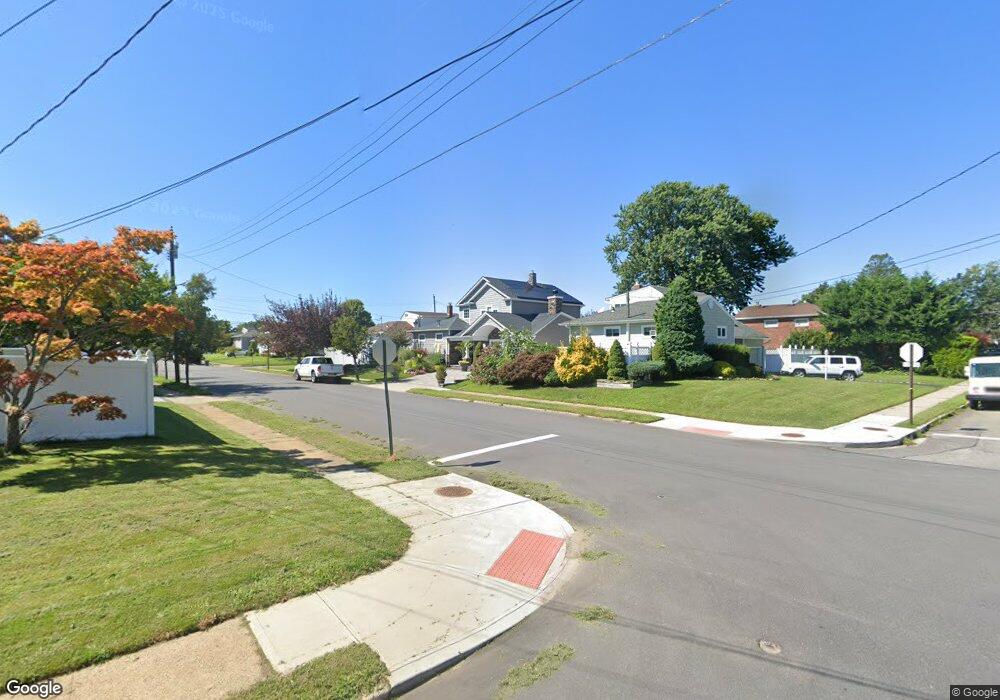
279 Cypress St Massapequa Park, NY 11762
Estimated Value: $860,633
3
Beds
2
Baths
2,219
Sq Ft
$388/Sq Ft
Est. Value
About This Home
This home is located at 279 Cypress St, Massapequa Park, NY 11762 and is currently estimated at $860,633, approximately $387 per square foot. 279 Cypress St is a home located in Nassau County with nearby schools including Massapequa High School - Ames Campus, Berner Middle School, and Massapequa High School.
Ownership History
Date
Name
Owned For
Owner Type
Purchase Details
Closed on
May 11, 2012
Sold by
Messina Jaysen and Messina Tara
Bought by
Gomes David and Gomes Katie
Current Estimated Value
Home Financials for this Owner
Home Financials are based on the most recent Mortgage that was taken out on this home.
Original Mortgage
$421,170
Outstanding Balance
$291,397
Interest Rate
3.87%
Mortgage Type
FHA
Estimated Equity
$569,236
Purchase Details
Closed on
Nov 29, 2006
Sold by
Ciccone Frank
Bought by
Messina Jaysen
Purchase Details
Closed on
Nov 15, 2002
Sold by
Nigro Anne
Bought by
Ciccone Frank
Create a Home Valuation Report for This Property
The Home Valuation Report is an in-depth analysis detailing your home's value as well as a comparison with similar homes in the area
Home Values in the Area
Average Home Value in this Area
Purchase History
| Date | Buyer | Sale Price | Title Company |
|---|---|---|---|
| Gomes David | $460,000 | All Shore Abstract Ltd | |
| Messina Jaysen | $540,000 | -- | |
| Ciccone Frank | $370,500 | -- |
Source: Public Records
Mortgage History
| Date | Status | Borrower | Loan Amount |
|---|---|---|---|
| Open | Gomes David | $421,170 |
Source: Public Records
Tax History Compared to Growth
Tax History
| Year | Tax Paid | Tax Assessment Tax Assessment Total Assessment is a certain percentage of the fair market value that is determined by local assessors to be the total taxable value of land and additions on the property. | Land | Improvement |
|---|---|---|---|---|
| 2025 | $10,633 | $558 | $171 | $387 |
| 2024 | $3,219 | $647 | $198 | $449 |
| 2023 | $9,951 | $647 | $203 | $444 |
| 2022 | $9,951 | $458 | $198 | $260 |
| 2021 | $9,359 | $453 | $196 | $257 |
| 2020 | $11,194 | $637 | $627 | $10 |
| 2019 | $9,278 | $683 | $630 | $53 |
| 2018 | $9,186 | $728 | $0 | $0 |
| 2017 | $6,295 | $774 | $520 | $254 |
| 2016 | $9,253 | $1,001 | $672 | $329 |
| 2015 | $3,379 | $1,001 | $672 | $329 |
| 2014 | $3,379 | $1,001 | $672 | $329 |
| 2013 | $3,162 | $1,001 | $672 | $329 |
Source: Public Records
Map
Nearby Homes