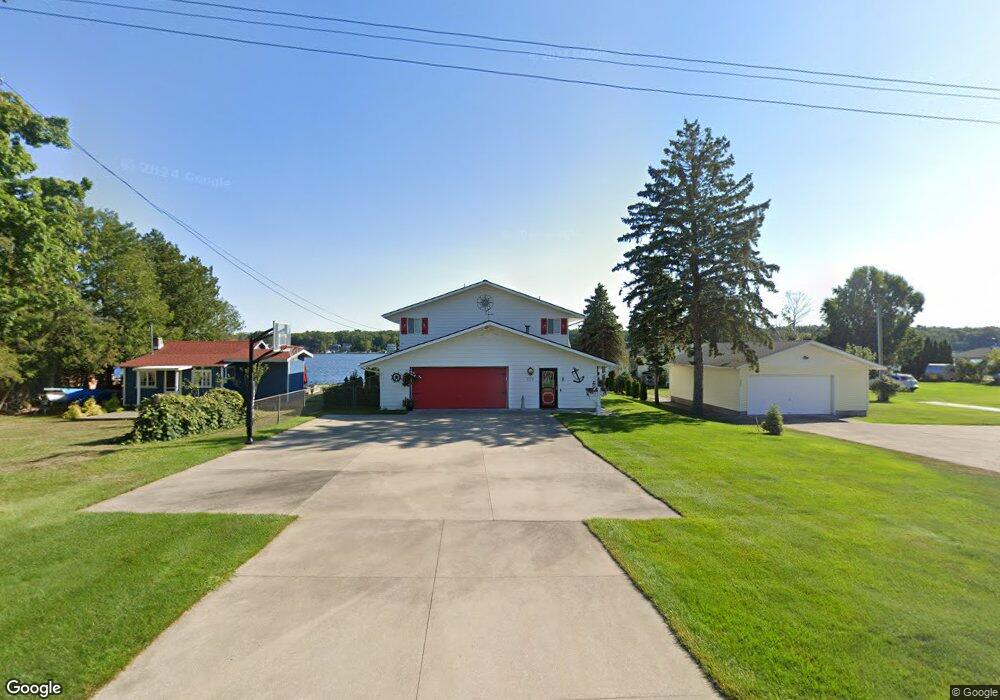
279 E Lake St Pentwater, MI 49449
Estimated Value: $1,083,000 - $1,262,000
4
Beds
3
Baths
--
Sq Ft
0.35
Acres
About This Home
This home is located at 279 E Lake St, Pentwater, MI 49449 and is currently estimated at $1,155,855. 279 E Lake St is a home located in Oceana County with nearby schools including Pentwater Public School.
Ownership History
Date
Name
Owned For
Owner Type
Purchase Details
Closed on
Oct 25, 2017
Sold by
Senko Michael J and Senko Annette M
Bought by
Senko Michael J and Senko Annette M
Current Estimated Value
Purchase Details
Closed on
Dec 30, 2011
Sold by
Kruer Frederic W and Kruer Mari
Bought by
Senko Michael and Senko Annette
Purchase Details
Closed on
Oct 13, 2011
Sold by
Kruer Frederic W and Kruer Mari E
Bought by
Us Bank National Association
Purchase Details
Closed on
Nov 6, 2009
Sold by
Cardinali August
Bought by
Kruer Frederic W and Kruer Mari
Purchase Details
Closed on
Aug 7, 2008
Sold by
Kruer Frederic W and Kruer Mari
Bought by
Cardinali August
Purchase Details
Closed on
Aug 10, 2005
Sold by
Johnson C Alan
Bought by
Kruer Frederic W
Home Financials for this Owner
Home Financials are based on the most recent Mortgage that was taken out on this home.
Original Mortgage
$97,500
Interest Rate
5.8%
Mortgage Type
Unknown
Create a Home Valuation Report for This Property
The Home Valuation Report is an in-depth analysis detailing your home's value as well as a comparison with similar homes in the area
Home Values in the Area
Average Home Value in this Area
Purchase History
| Date | Buyer | Sale Price | Title Company |
|---|---|---|---|
| Senko Michael J | -- | Attorney | |
| Senko Michael | $402,000 | None Available | |
| Us Bank National Association | $590,509 | None Available | |
| Kruer Frederic W | -- | None Available | |
| Cardinali August | -- | None Available | |
| Kruer Frederic W | $650,000 | Lighthouse Title Inc |
Source: Public Records
Mortgage History
| Date | Status | Borrower | Loan Amount |
|---|---|---|---|
| Previous Owner | Kruer Frederic W | $97,500 | |
| Previous Owner | Kruer Frederic W | $520,000 |
Source: Public Records
Tax History Compared to Growth
Tax History
| Year | Tax Paid | Tax Assessment Tax Assessment Total Assessment is a certain percentage of the fair market value that is determined by local assessors to be the total taxable value of land and additions on the property. | Land | Improvement |
|---|---|---|---|---|
| 2025 | $11,131 | $513,800 | $513,800 | $0 |
| 2024 | $6,102 | $478,200 | $478,200 | $0 |
| 2023 | $10,099 | $411,600 | $411,600 | $0 |
| 2022 | $12,884 | $382,800 | $0 | $0 |
| 2021 | $12,544 | $330,000 | $330,000 | $0 |
| 2020 | $12,463 | $306,000 | $306,000 | $0 |
| 2019 | $12,194 | $254,100 | $0 | $0 |
| 2018 | $11,360 | $230,500 | $0 | $0 |
| 2017 | $11,360 | $223,200 | $0 | $0 |
| 2016 | -- | $219,900 | $0 | $0 |
| 2013 | -- | $198,900 | $0 | $0 |
Source: Public Records
Map
Nearby Homes
- 517 S Wythe St
- 935 6th St
- 1112 2nd St
- 90 S Clymer St
- 1209 6th St
- 5921 W Longbridge Rd
- 0000 Park St
- 41 N Dover St
- 340 E Hanover St
- vl 3rd Ave
- 0 Longbridge Rd
- LOT 38 Longbridge Rd
- 559 Sands St
- 0 Sands St - Lot A
- 0 Sands Street - Vacant
- 0 W Branch St
- 0 Morris St - Lot B Unit 25010940
- 5293 W Monroe Rd
- 921 N Hancock St
- 0 N 56th Ave Unit Parcel A 25010626