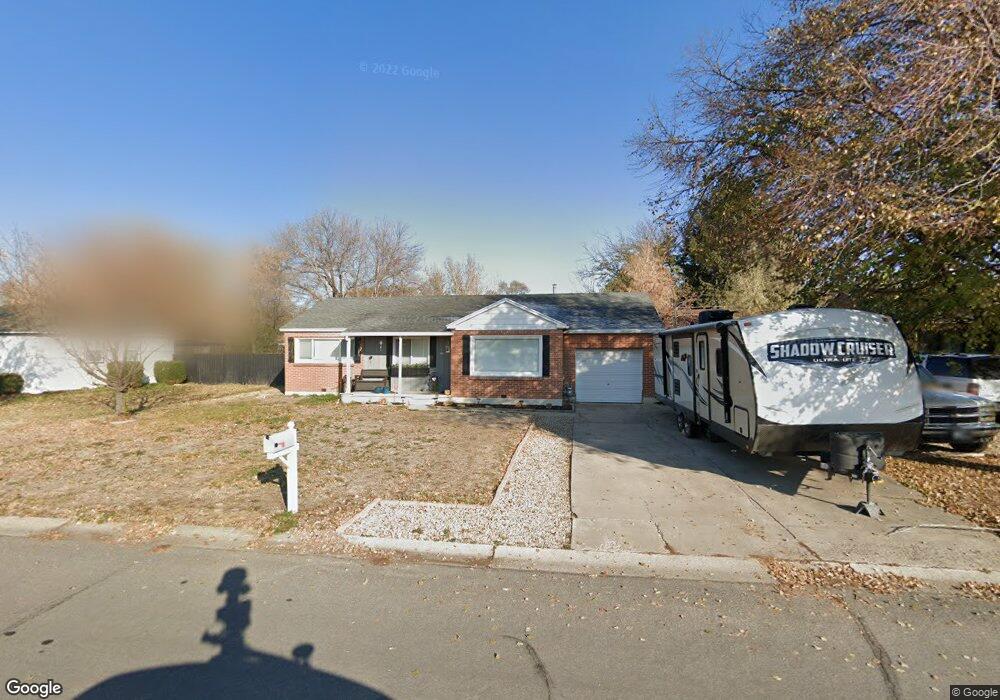
279 Francis Ave Unit 28 Layton, UT 84041
Estimated Value: $382,000 - $414,000
3
Beds
1
Bath
1,382
Sq Ft
$289/Sq Ft
Est. Value
About This Home
This home is located at 279 Francis Ave Unit 28, Layton, UT 84041 and is currently estimated at $399,401, approximately $289 per square foot. 279 Francis Ave Unit 28 is a home located in Davis County with nearby schools including Crestview Elementary School, Central Davis Junior High School, and Layton High School.
Ownership History
Date
Name
Owned For
Owner Type
Purchase Details
Closed on
Mar 15, 2023
Sold by
Joyce Jeremy
Bought by
Castillo Kimberly and Lemus Jose Luis
Current Estimated Value
Home Financials for this Owner
Home Financials are based on the most recent Mortgage that was taken out on this home.
Original Mortgage
$20,888
Outstanding Balance
$20,242
Interest Rate
6.6%
Estimated Equity
$379,159
Purchase Details
Closed on
Feb 14, 2008
Sold by
Stephens Jerry H and Stephens Ophelia M
Bought by
Lyon Damen and Lyon Katie
Home Financials for this Owner
Home Financials are based on the most recent Mortgage that was taken out on this home.
Original Mortgage
$148,050
Interest Rate
6.04%
Mortgage Type
VA
Create a Home Valuation Report for This Property
The Home Valuation Report is an in-depth analysis detailing your home's value as well as a comparison with similar homes in the area
Home Values in the Area
Average Home Value in this Area
Purchase History
| Date | Buyer | Sale Price | Title Company |
|---|---|---|---|
| Castillo Kimberly | -- | Old Republic Title | |
| Lyon Damen | -- | First American Title |
Source: Public Records
Mortgage History
| Date | Status | Borrower | Loan Amount |
|---|---|---|---|
| Open | Castillo Kimberly | $20,888 | |
| Open | Castillo Kimberly | $360,352 | |
| Previous Owner | Lyon Damen | $148,050 |
Source: Public Records
Tax History
| Year | Tax Paid | Tax Assessment Tax Assessment Total Assessment is a certain percentage of the fair market value that is determined by local assessors to be the total taxable value of land and additions on the property. | Land | Improvement |
|---|---|---|---|---|
| 2025 | $1,761 | $184,800 | $99,118 | $85,682 |
| 2024 | $1,701 | $179,850 | $115,664 | $64,186 |
| 2023 | $1,701 | $317,000 | $139,109 | $177,891 |
| 2022 | $1,619 | $163,900 | $73,071 | $90,829 |
| 2021 | $1,524 | $230,000 | $101,243 | $128,757 |
| 2020 | $1,374 | $199,000 | $85,715 | $113,285 |
| 2019 | $1,333 | $189,000 | $81,892 | $107,108 |
| 2018 | $1,194 | $170,000 | $81,892 | $88,108 |
| 2016 | $1,033 | $75,845 | $25,821 | $50,024 |
| 2015 | $976 | $68,090 | $25,821 | $42,269 |
| 2014 | $953 | $67,919 | $25,821 | $42,098 |
| 2013 | -- | $75,117 | $16,544 | $58,573 |
Source: Public Records
Map
Nearby Homes
- 279 Francis Ave
- 267 Francis Ave
- 295 Francis Ave
- 272 Glen Ave
- 258 Glen Ave
- 284 Glen Ave
- 257 Francis Ave
- 321 Francis Ave
- 284 Glen Ave N
- 278 Francis Ave
- 266 Francis Ave
- 296 Francis Ave
- 248 Glen Place
- 791 La Verde St
- 254 Francis Ave
- 296 Glen Ave
- 304 Francis Ave
- 329 Francis Ave
- 815 La Verde St
- 244 Francis Ave
Your Personal Tour Guide
Ask me questions while you tour the home.