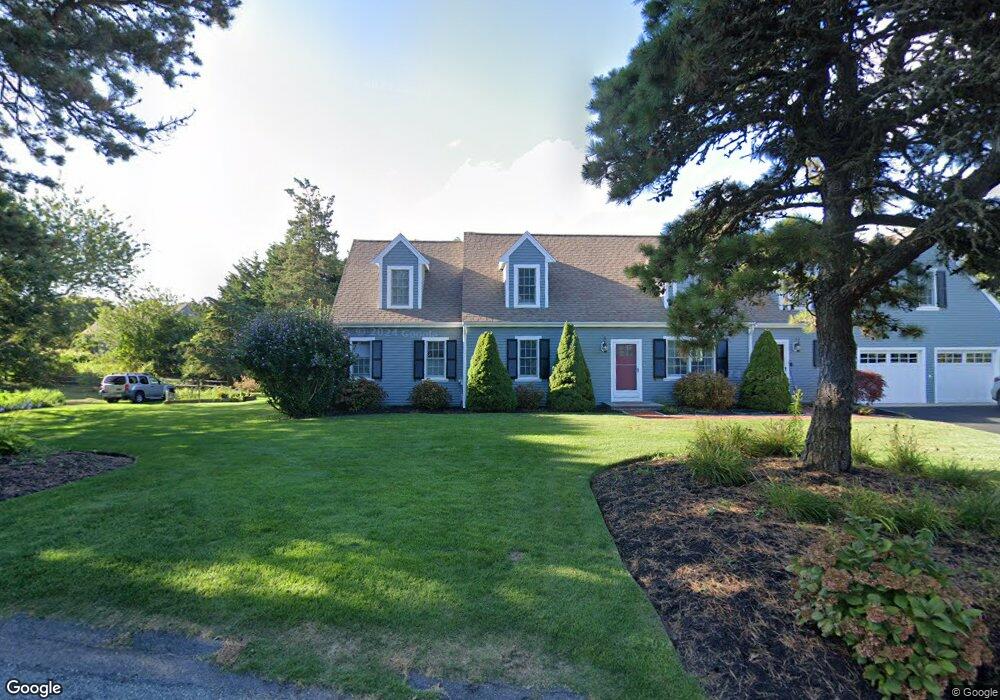
279 Main St Dennis Port, MA 2639
Dennis Port NeighborhoodEstimated Value: $809,000 - $1,448,000
4
Beds
2
Baths
3,080
Sq Ft
$359/Sq Ft
Est. Value
About This Home
This home is located at 279 Main St, Dennis Port, MA 2639 and is currently estimated at $1,105,426, approximately $358 per square foot. 279 Main St is a home located in Barnstable County with nearby schools including Dennis-Yarmouth Regional High School and St. Pius X. School.
Ownership History
Date
Name
Owned For
Owner Type
Purchase Details
Closed on
Dec 22, 1999
Sold by
Bates Page L and Bates Robert J
Bought by
Boonisar Richard M and Boonisar Ann M
Current Estimated Value
Home Financials for this Owner
Home Financials are based on the most recent Mortgage that was taken out on this home.
Original Mortgage
$200,000
Outstanding Balance
$61,429
Interest Rate
7.61%
Mortgage Type
Purchase Money Mortgage
Estimated Equity
$1,043,997
Create a Home Valuation Report for This Property
The Home Valuation Report is an in-depth analysis detailing your home's value as well as a comparison with similar homes in the area
Home Values in the Area
Average Home Value in this Area
Purchase History
| Date | Buyer | Sale Price | Title Company |
|---|---|---|---|
| Boonisar Richard M | $475,000 | -- |
Source: Public Records
Mortgage History
| Date | Status | Borrower | Loan Amount |
|---|---|---|---|
| Open | Boonisar Richard M | $200,000 |
Source: Public Records
Tax History Compared to Growth
Tax History
| Year | Tax Paid | Tax Assessment Tax Assessment Total Assessment is a certain percentage of the fair market value that is determined by local assessors to be the total taxable value of land and additions on the property. | Land | Improvement |
|---|---|---|---|---|
| 2025 | $4,107 | $948,500 | $269,300 | $679,200 |
| 2024 | $3,785 | $862,200 | $259,000 | $603,200 |
| 2023 | $3,729 | $798,600 | $235,400 | $563,200 |
| 2022 | $3,596 | $642,100 | $212,000 | $430,100 |
| 2021 | $3,903 | $647,300 | $207,900 | $439,400 |
| 2020 | $3,970 | $650,900 | $207,900 | $443,000 |
| 2019 | $4,065 | $658,800 | $203,800 | $455,000 |
| 2018 | $3,502 | $552,300 | $158,800 | $393,500 |
| 2017 | $3,477 | $565,400 | $158,800 | $406,600 |
| 2016 | $3,526 | $540,000 | $194,000 | $346,000 |
| 2015 | $3,456 | $540,000 | $194,000 | $346,000 |
| 2014 | $3,499 | $551,100 | $194,000 | $357,100 |
Source: Public Records
Map
Nearby Homes
- 268 Main St
- 125 Main St Unit 3
- 4 Coffey Ln
- 104 Toms Path
- 104 Toms Path
- 71 Main St
- 10 Candlewood Ln Unit 2-1
- 12 Candlewood Ln Unit 2-9
- 12 Candlewood Ln Unit 1-6
- 18 Holiday Ln
- 78 Upper County Rd Unit A&B
- 78 Upper County Rd
- 9 Country Ln
- 24 Indian Trail
- 12 Cross St
- 22 Ferncliff Rd
- 47 Telegraph Rd Unit 1
- 102 Sea St
- 20 Aunt Debbys Rd
- 95 Center St