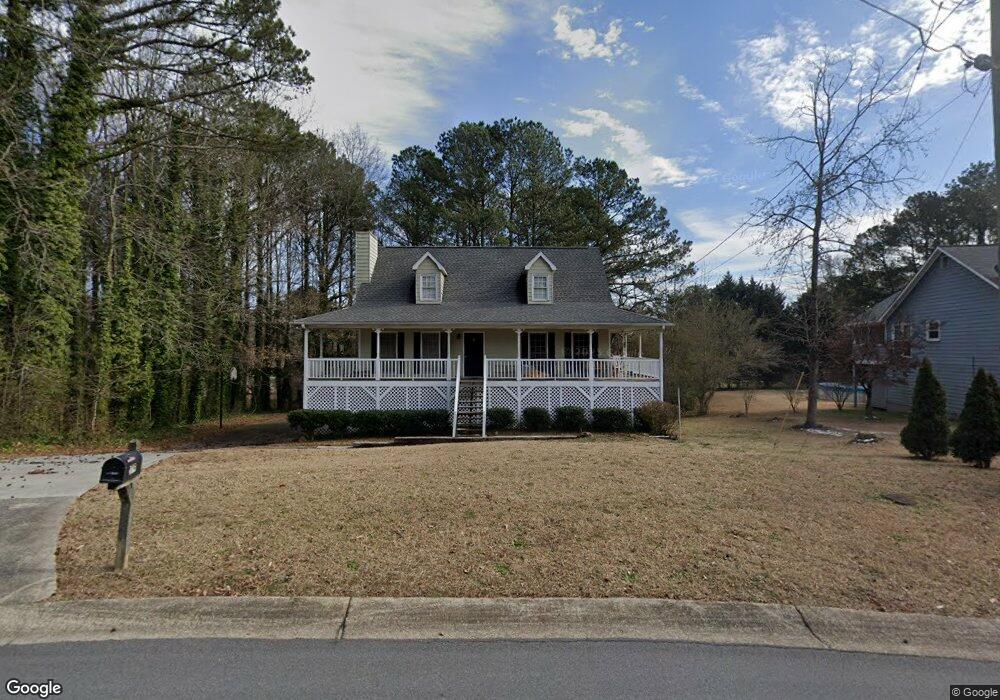
279 Maplewood Ln Acworth, GA 30101
Cedarcrest NeighborhoodEstimated Value: $352,000 - $370,000
3
Beds
2
Baths
1,502
Sq Ft
$241/Sq Ft
Est. Value
About This Home
This home is located at 279 Maplewood Ln, Acworth, GA 30101 and is currently estimated at $361,850, approximately $240 per square foot. 279 Maplewood Ln is a home located in Paulding County with nearby schools including Roland W. Russom Elementary School, East Paulding Middle School, and North Paulding High School.
Ownership History
Date
Name
Owned For
Owner Type
Purchase Details
Closed on
Jan 21, 2013
Sold by
Hill Beverly C
Bought by
Whitlock William N and Whitlock Marjorie H
Current Estimated Value
Create a Home Valuation Report for This Property
The Home Valuation Report is an in-depth analysis detailing your home's value as well as a comparison with similar homes in the area
Home Values in the Area
Average Home Value in this Area
Purchase History
| Date | Buyer | Sale Price | Title Company |
|---|---|---|---|
| Whitlock William N | -- | -- |
Source: Public Records
Tax History Compared to Growth
Tax History
| Year | Tax Paid | Tax Assessment Tax Assessment Total Assessment is a certain percentage of the fair market value that is determined by local assessors to be the total taxable value of land and additions on the property. | Land | Improvement |
|---|---|---|---|---|
| 2024 | $3,233 | $129,964 | $18,000 | $111,964 |
| 2023 | $3,521 | $135,056 | $12,000 | $123,056 |
| 2022 | $2,684 | $102,972 | $12,000 | $90,972 |
| 2021 | $2,445 | $84,120 | $12,000 | $72,120 |
| 2020 | $2,411 | $81,172 | $12,000 | $69,172 |
| 2019 | $2,315 | $76,832 | $12,000 | $64,832 |
| 2018 | $1,899 | $63,036 | $12,000 | $51,036 |
| 2017 | $1,834 | $60,040 | $12,000 | $48,040 |
| 2016 | $1,777 | $58,764 | $12,000 | $46,764 |
| 2015 | $1,736 | $56,408 | $12,000 | $44,408 |
| 2014 | $1,650 | $52,256 | $12,000 | $40,256 |
| 2013 | -- | $28,840 | $12,000 | $16,840 |
Source: Public Records
Map
Nearby Homes
- 430 Maplewood Ln
- 107 Stonewood Creek Dr
- 195 Maplelake Dr
- 252 Stonewood Creek Dr
- 6351 Granbury Walk NW
- 6412 Old Stilesboro Rd NW
- 90 Old Stilesboro Rd NW
- 6321 Cheatham Lake Dr NW
- 77 Rushing Creek Trail
- 2729 Cheatham Ct NW
- The Everleigh Plan at Madeira
- 137 Boxwood Way
- 49 Boxwood Way
- 42 Stone Ct
- 100 Crown Vista Way
- 1302 Cedarcrest Blvd
- 645 Old Dallas Acworth Rd N
- 301 Maplewood Ln
- 0 Maplewood Ln Unit 7421620
- 0 Maplewood Ln Unit 8560471
- 0 Maplewood Ln Unit 8412514
- 0 Maplewood Ln Unit 8335848
- 0 Maplewood Ln Unit 7033760
- 247 Maplewood Ln
- 89 Maplewood Terrace
- 105 Maplewood Terrace
- 59 Maplewood Terrace
- 225 Maplewood Ln
- 290 Maplewood Ln
- 365 Maplewood Ln
- 310 Maplewood Ln
- 258 Maplewood Ln
- 129 Maplewood Terrace
- 13 Maplewood Terrace
- 205 Maplewood Ln
- 240 Maplewood Ln
- 332 Maplewood Ln