Estimated Value: $196,000 - $325,000
Studio
--
Bath
2,064
Sq Ft
$115/Sq Ft
Est. Value
About This Home
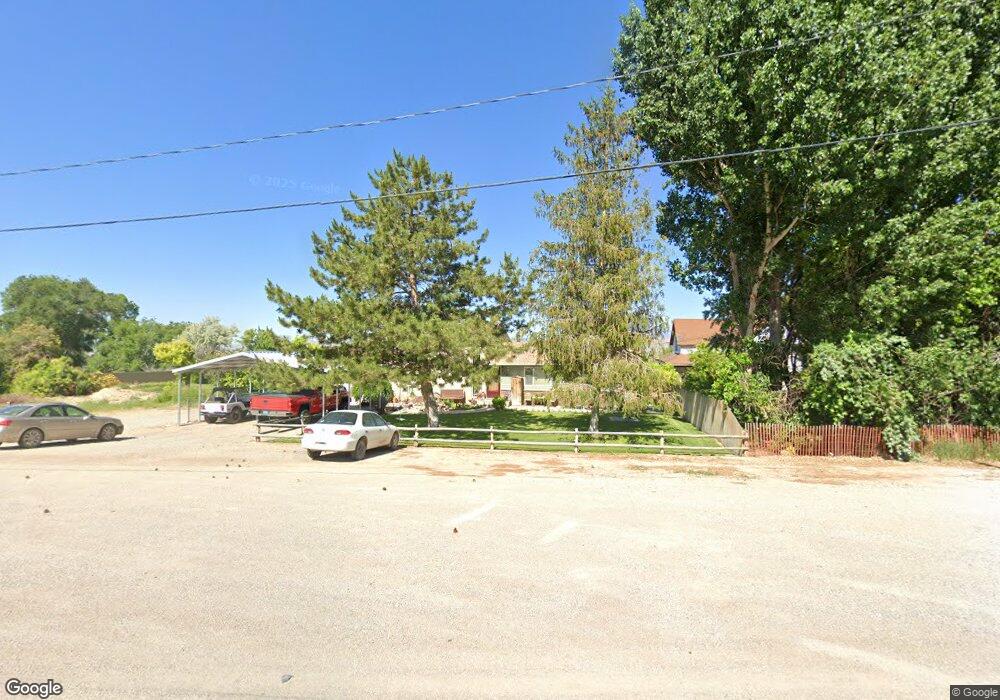
This home is located at 279 N Main St, Lund, NV 89317 and is currently estimated at $237,556, approximately $115 per square foot. 279 N Main St is a home with nearby schools including Lund High School.
Ownership History
Date
Name
Owned For
Owner Type
Purchase Details
Closed on
Mar 19, 2021
Sold by
Bybee Jared and Bybee Roxanne
Bought by
Hooley John and Hooley Joni
Current Estimated Value
Purchase Details
Closed on
Feb 17, 2009
Sold by
Neads Scott E and Neads Scott Edward
Bought by
Jones Roxanne G
Home Financials for this Owner
Home Financials are based on the most recent Mortgage that was taken out on this home.
Original Mortgage
$80,300
Interest Rate
5.08%
Purchase Details
Closed on
Jul 20, 2006
Sold by
Neads Joni
Bought by
Neads Scott Edwards
Create a Home Valuation Report for This Property
The Home Valuation Report is an in-depth analysis detailing your home's value as well as a comparison with similar homes in the area
Purchase History
| Date | Buyer | Sale Price | Title Company |
|---|---|---|---|
| Hooley John | $83,482 | Acquired Ttl As Raxanne Jone | |
| Jones Roxanne G | $90,000 | Stewart Title Of Nevada, 665 | |
| Neads Scott Edwards | -- | -- |
Source: Public Records
Mortgage History
| Date | Status | Borrower | Loan Amount |
|---|---|---|---|
| Previous Owner | Jones Roxanne G | $80,300 |
Source: Public Records
Tax History
| Year | Tax Paid | Tax Assessment Tax Assessment Total Assessment is a certain percentage of the fair market value that is determined by local assessors to be the total taxable value of land and additions on the property. | Land | Improvement |
|---|---|---|---|---|
| 2025 | $1,294 | $38,242 | $2,815 | $35,427 |
| 2024 | $1,294 | $38,012 | $2,513 | $35,499 |
| 2023 | $1,294 | $33,655 | $1,926 | $31,729 |
| 2022 | $1,114 | $29,463 | $1,926 | $27,537 |
| 2021 | $1,046 | $27,582 | $1,926 | $25,656 |
| 2020 | $1,080 | $29,219 | $1,852 | $27,367 |
| 2019 | $1,074 | $28,363 | $1,852 | $26,511 |
| 2018 | $1,045 | $26,883 | $1,852 | $25,031 |
| 2017 | $1,049 | $26,990 | $1,852 | $25,138 |
| 2016 | $1,032 | $22,756 | $1,696 | $21,060 |
| 2015 | $776 | $22,547 | $1,696 | $20,851 |
| 2014 | $776 | $22,159 | $1,717 | $20,442 |
Source: Public Records
Map
Nearby Homes
Your Personal Tour Guide
Ask me questions while you tour the home.