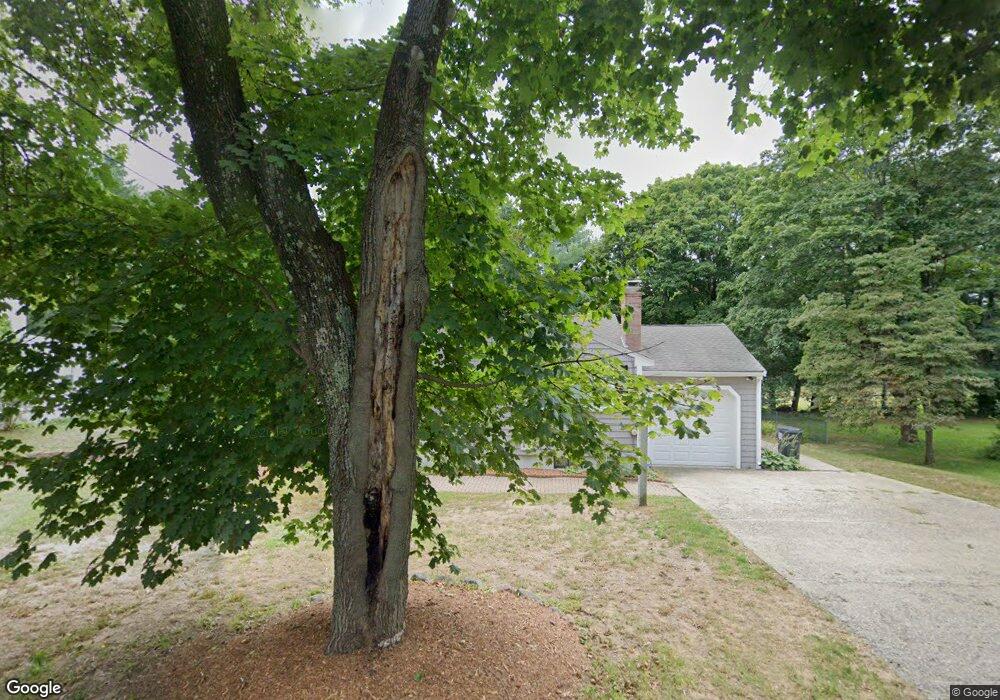
279 Plain St Millis, MA 02054
Estimated Value: $524,054 - $578,000
3
Beds
1
Bath
992
Sq Ft
$560/Sq Ft
Est. Value
About This Home
This home is located at 279 Plain St, Millis, MA 02054 and is currently estimated at $555,514, approximately $559 per square foot. 279 Plain St is a home located in Norfolk County with nearby schools including Clyde F Brown, Millis Middle School, and Millis High School.
Ownership History
Date
Name
Owned For
Owner Type
Purchase Details
Closed on
Nov 17, 2000
Sold by
Pelletier Gary D
Bought by
Bolio Carol G
Current Estimated Value
Home Financials for this Owner
Home Financials are based on the most recent Mortgage that was taken out on this home.
Original Mortgage
$175,920
Outstanding Balance
$60,941
Interest Rate
7.78%
Mortgage Type
Purchase Money Mortgage
Estimated Equity
$494,574
Purchase Details
Closed on
Sep 27, 1996
Sold by
Hogan James M
Bought by
Pelletier Gary D
Home Financials for this Owner
Home Financials are based on the most recent Mortgage that was taken out on this home.
Original Mortgage
$139,650
Interest Rate
7.83%
Mortgage Type
Purchase Money Mortgage
Create a Home Valuation Report for This Property
The Home Valuation Report is an in-depth analysis detailing your home's value as well as a comparison with similar homes in the area
Home Values in the Area
Average Home Value in this Area
Purchase History
| Date | Buyer | Sale Price | Title Company |
|---|---|---|---|
| Bolio Carol G | $219,900 | -- | |
| Pelletier Gary D | $147,000 | -- |
Source: Public Records
Mortgage History
| Date | Status | Borrower | Loan Amount |
|---|---|---|---|
| Open | Pelletier Gary D | $175,920 | |
| Previous Owner | Pelletier Gary D | $138,000 | |
| Previous Owner | Pelletier Gary D | $139,650 |
Source: Public Records
Tax History
| Year | Tax Paid | Tax Assessment Tax Assessment Total Assessment is a certain percentage of the fair market value that is determined by local assessors to be the total taxable value of land and additions on the property. | Land | Improvement |
|---|---|---|---|---|
| 2025 | $7,190 | $438,400 | $233,200 | $205,200 |
| 2024 | $6,798 | $414,000 | $215,300 | $198,700 |
| 2023 | $6,132 | $350,600 | $171,600 | $179,000 |
| 2022 | $6,633 | $351,300 | $184,100 | $167,200 |
| 2021 | $6,296 | $320,900 | $159,100 | $161,800 |
| 2020 | $5,921 | $294,000 | $148,700 | $145,300 |
| 2019 | $5,129 | $274,300 | $135,600 | $138,700 |
| 2018 | $4,943 | $274,300 | $135,600 | $138,700 |
| 2017 | $4,587 | $249,000 | $116,100 | $132,900 |
| 2016 | $4,343 | $249,000 | $116,100 | $132,900 |
| 2015 | $4,233 | $249,000 | $116,100 | $132,900 |
Source: Public Records
Map
Nearby Homes
- 25 Bayberry Cir Unit 25
- 20 Hemlock Cir
- 227 Village St
- 64 Village St
- 33 Spencer St
- 11 Parnell St
- 5 Apple Rock Rd
- 6 Village St
- 324 Union St Unit 1
- 14 Teresa Dr
- 13 Teresa Dr
- 6 April Way
- 10 April Way
- 22 May Rd
- 6 Rosenfeld Rd
- 188 Pleasant St
- 200 Pleasant St
- 28 Key St Unit 28
- 43 Whichita Rd
- 33 Whichita Rd
Your Personal Tour Guide
Ask me questions while you tour the home.