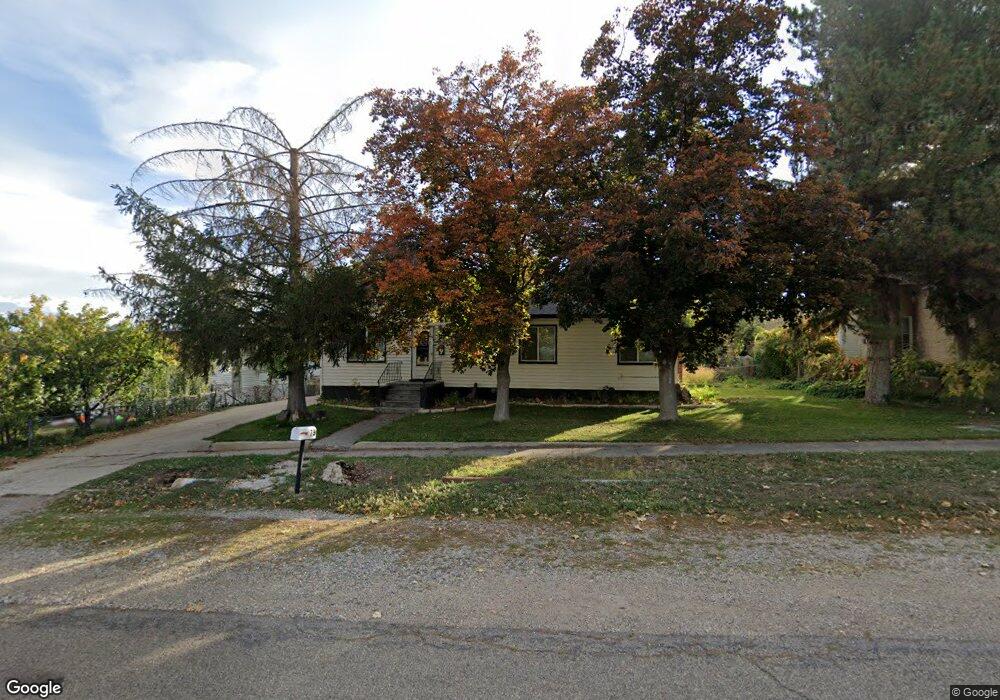
279 S 300 E Payson, UT 84651
Estimated Value: $438,000 - $474,000
5
Beds
2
Baths
2,447
Sq Ft
$185/Sq Ft
Est. Value
About This Home
This home is located at 279 S 300 E, Payson, UT 84651 and is currently estimated at $452,874, approximately $185 per square foot. 279 S 300 E is a home located in Utah County with nearby schools including Park View Elementary, Payson Junior High School, and Payson High School.
Ownership History
Date
Name
Owned For
Owner Type
Purchase Details
Closed on
Feb 8, 2017
Sold by
Menlove Von J and Menlove Annette
Bought by
Cerbante Enrique Suarez
Current Estimated Value
Home Financials for this Owner
Home Financials are based on the most recent Mortgage that was taken out on this home.
Original Mortgage
$215,916
Outstanding Balance
$177,709
Interest Rate
3.99%
Mortgage Type
FHA
Estimated Equity
$275,165
Create a Home Valuation Report for This Property
The Home Valuation Report is an in-depth analysis detailing your home's value as well as a comparison with similar homes in the area
Home Values in the Area
Average Home Value in this Area
Purchase History
| Date | Buyer | Sale Price | Title Company |
|---|---|---|---|
| Cerbante Enrique Suarez | -- | Select Title Ins Agency | |
| Cerbante Enrigue Suarez | -- | Select Title Ins Agency |
Source: Public Records
Mortgage History
| Date | Status | Borrower | Loan Amount |
|---|---|---|---|
| Open | Cerbante Enrigue Suarez | $215,916 | |
| Closed | Cerbante Enrique Suarez | $12,954 |
Source: Public Records
Tax History
| Year | Tax Paid | Tax Assessment Tax Assessment Total Assessment is a certain percentage of the fair market value that is determined by local assessors to be the total taxable value of land and additions on the property. | Land | Improvement |
|---|---|---|---|---|
| 2025 | $2,208 | $224,345 | -- | -- |
| 2024 | $2,208 | $224,730 | $0 | $0 |
| 2023 | $2,273 | $231,990 | $0 | $0 |
| 2022 | $2,156 | $216,370 | $0 | $0 |
| 2021 | $1,790 | $288,200 | $93,500 | $194,700 |
| 2020 | $1,708 | $269,000 | $85,000 | $184,000 |
| 2019 | $1,488 | $240,200 | $73,400 | $166,800 |
| 2018 | $1,338 | $208,200 | $61,800 | $146,400 |
| 2017 | $1,227 | $102,740 | $0 | $0 |
| 2016 | $1,090 | $90,640 | $0 | $0 |
| 2015 | $1,056 | $87,230 | $0 | $0 |
| 2014 | $944 | $78,485 | $0 | $0 |
Source: Public Records
Map
Nearby Homes
Your Personal Tour Guide
Ask me questions while you tour the home.