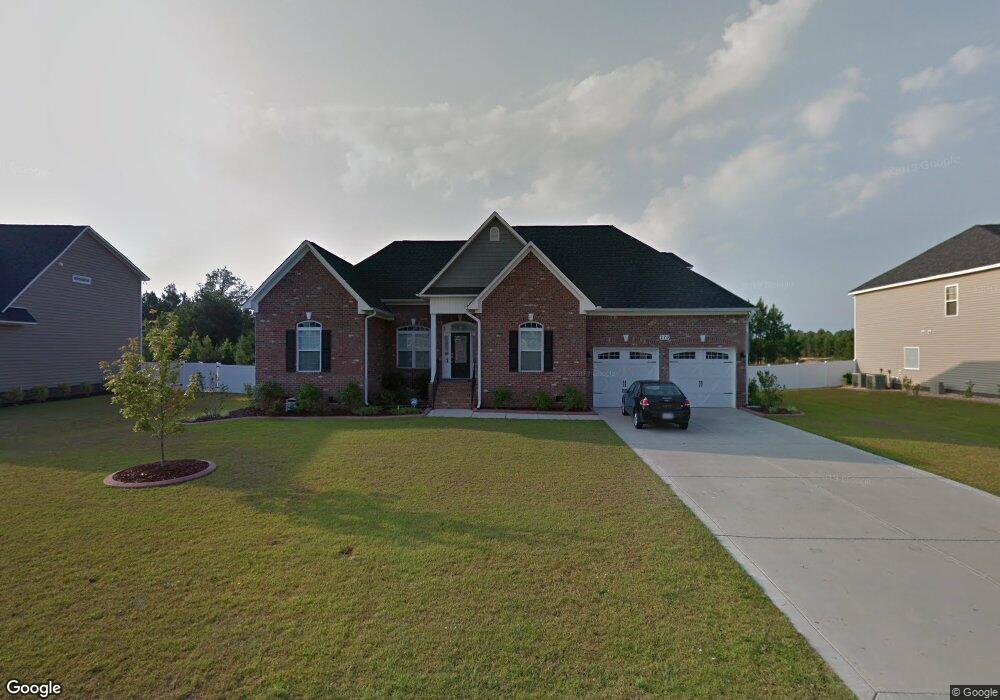
279 Saint Johns Loop Raeford, NC 28376
Estimated Value: $364,000 - $406,768
Studio
4
Baths
2,926
Sq Ft
$134/Sq Ft
Est. Value
About This Home
This home is located at 279 Saint Johns Loop, Raeford, NC 28376 and is currently estimated at $390,692, approximately $133 per square foot. 279 Saint Johns Loop is a home located in Hoke County with nearby schools including Rockfish Hoke Elementary School, East Hoke Middle, and Hoke County High.
Ownership History
Date
Name
Owned For
Owner Type
Purchase Details
Closed on
Jan 13, 2010
Sold by
H And H Constructors Inc
Bought by
Scott Randal L and Scott Jennifer E
Current Estimated Value
Home Financials for this Owner
Home Financials are based on the most recent Mortgage that was taken out on this home.
Original Mortgage
$330,456
Outstanding Balance
$213,096
Interest Rate
4.68%
Mortgage Type
VA
Estimated Equity
$177,596
Purchase Details
Closed on
Sep 11, 2009
Sold by
Westgate Of Hoke Llc
Bought by
H And H Constructors Inc
Create a Home Valuation Report for This Property
The Home Valuation Report is an in-depth analysis detailing your home's value as well as a comparison with similar homes in the area
Home Values in the Area
Average Home Value in this Area
Purchase History
| Date | Buyer | Sale Price | Title Company |
|---|---|---|---|
| Scott Randal L | $320,000 | -- | |
| H And H Constructors Inc | $34,500 | -- |
Source: Public Records
Mortgage History
| Date | Status | Borrower | Loan Amount |
|---|---|---|---|
| Open | Scott Randal L | $330,456 |
Source: Public Records
Tax History
| Year | Tax Paid | Tax Assessment Tax Assessment Total Assessment is a certain percentage of the fair market value that is determined by local assessors to be the total taxable value of land and additions on the property. | Land | Improvement |
|---|---|---|---|---|
| 2025 | $2,392 | $324,220 | $22,000 | $302,220 |
| 2024 | $2,392 | $324,220 | $22,000 | $302,220 |
| 2023 | $2,392 | $324,220 | $22,000 | $302,220 |
| 2022 | $2,704 | $324,220 | $22,000 | $302,220 |
| 2021 | $2,812 | $329,730 | $22,000 | $307,730 |
| 2020 | $2,865 | $329,730 | $22,000 | $307,730 |
| 2019 | $2,865 | $329,730 | $22,000 | $307,730 |
| 2018 | $2,865 | $329,730 | $22,000 | $307,730 |
| 2017 | $2,865 | $329,730 | $22,000 | $307,730 |
| 2016 | $2,810 | $329,730 | $22,000 | $307,730 |
| 2015 | $2,810 | $329,730 | $22,000 | $307,730 |
| 2014 | $2,781 | $329,730 | $22,000 | $307,730 |
| 2013 | -- | $326,810 | $33,000 | $293,810 |
Source: Public Records
Map
Nearby Homes
- 172 Collinwood Dr
- 169 Eclipse Ct
- 667 Saint Johns Loop
- 1486 Saint Johns Loop
- 202 Ivy Stone Dr
- 151 Ivy Stone Dr
- 168 Bennington Dr
- 573 Thorncliff Dr
- 188 Stockbridge Dr
- 505 Collinwood Dr
- 258 Lennox Loop
- 286 Sedgefield Dr
- 219 Stockbridge Dr
- 151 Huntington Dr
- 601 Collinwood Dr
- 208 Lochwood Dr
- 196 Lochwood Dr
- 131 Emerywood Ct
- 273 Saint George Dr
- 1093 Saint Johns Loop
- 279 St Johns Loop
- 261 St Johns Loop
- 261 Saint Johns Loop
- 297 Saint Johns Loop
- 297 St John's Loop
- 234 Snipe Ct
- 315 Saint Johns Loop
- 245 Saint Johns Loop
- 245 St Johns Loop
- 245 St John's Loop
- 290 St Johns (L533) Loop
- 245 Snipe Ct
- 290 Saint Johns Loop
- 268 Saint Johns Loop
- 268 St Johns (L532) Loop
- 238 Snipe Ct
- 308 St Johns Loop
- 308 St John's Loop
- 308 Saint Johns Loop
- 248 Saint Johns Loop
Your Personal Tour Guide
Ask me questions while you tour the home.