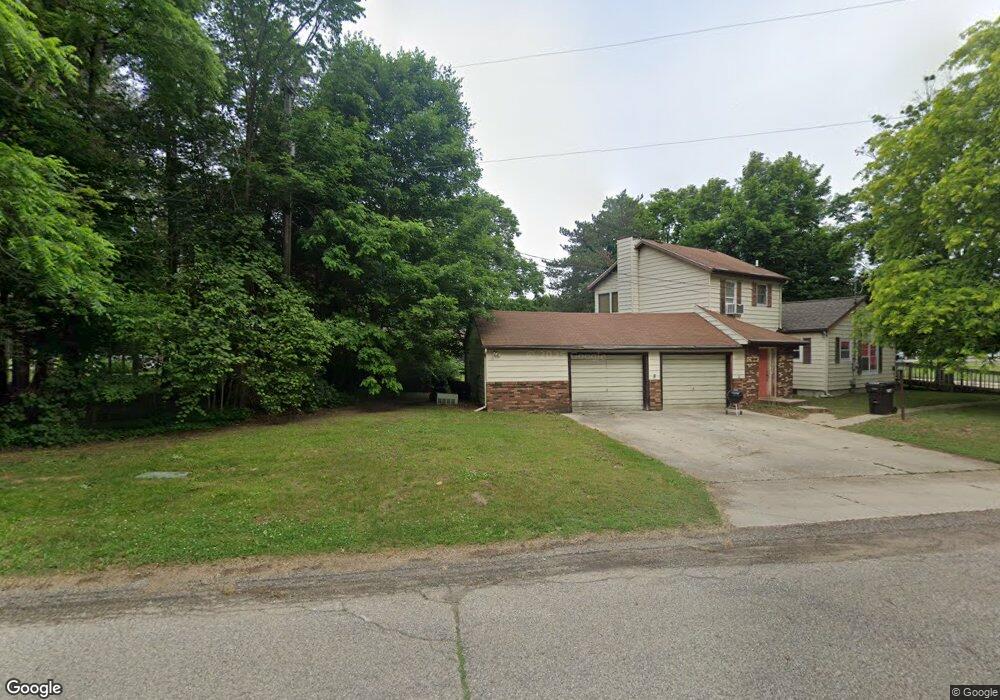
279 Thomas St Allegan, MI 49010
Estimated Value: $331,770
--
Bed
--
Bath
2,684
Sq Ft
$124/Sq Ft
Est. Value
About This Home
This home is located at 279 Thomas St, Allegan, MI 49010 and is currently estimated at $331,770, approximately $123 per square foot. 279 Thomas St is a home located in Allegan County with nearby schools including West Ward Elementary School, L.E. White Middle School, and Allegan High School.
Ownership History
Date
Name
Owned For
Owner Type
Purchase Details
Closed on
May 26, 2021
Sold by
Ruse David P and Ruse Mona Esse
Bought by
225 Property Management Llc
Current Estimated Value
Purchase Details
Closed on
Jan 27, 2010
Sold by
Ruse David P and Ruse Mona Esse
Bought by
The David P Ruse & Mona Esse Ruse Family
Create a Home Valuation Report for This Property
The Home Valuation Report is an in-depth analysis detailing your home's value as well as a comparison with similar homes in the area
Home Values in the Area
Average Home Value in this Area
Purchase History
| Date | Buyer | Sale Price | Title Company |
|---|---|---|---|
| 225 Property Management Llc | -- | None Available | |
| The David P Ruse & Mona Esse Ruse Family | -- | Attorney |
Source: Public Records
Mortgage History
| Date | Status | Borrower | Loan Amount |
|---|---|---|---|
| Closed | 225 Property Management Llc | $0 |
Source: Public Records
Tax History Compared to Growth
Tax History
| Year | Tax Paid | Tax Assessment Tax Assessment Total Assessment is a certain percentage of the fair market value that is determined by local assessors to be the total taxable value of land and additions on the property. | Land | Improvement |
|---|---|---|---|---|
| 2025 | $4,460 | $131,600 | $12,500 | $119,100 |
| 2024 | $4,046 | $136,400 | $11,900 | $124,500 |
| 2023 | $4,046 | $83,900 | $7,000 | $76,900 |
| 2022 | $4,046 | $78,900 | $6,300 | $72,600 |
| 2021 | $1,330 | $76,100 | $10,100 | $66,000 |
| 2020 | $1,330 | $76,900 | $9,700 | $67,200 |
| 2019 | $1,267 | $72,700 | $9,200 | $63,500 |
| 2018 | $1,267 | $58,700 | $9,100 | $49,600 |
| 2017 | $0 | $52,300 | $7,100 | $45,200 |
| 2016 | $0 | $58,300 | $7,800 | $50,500 |
| 2015 | -- | $58,300 | $7,800 | $50,500 |
| 2014 | -- | $61,100 | $8,200 | $52,900 |
| 2013 | -- | $60,300 | $8,500 | $51,800 |
Source: Public Records
Map
Nearby Homes