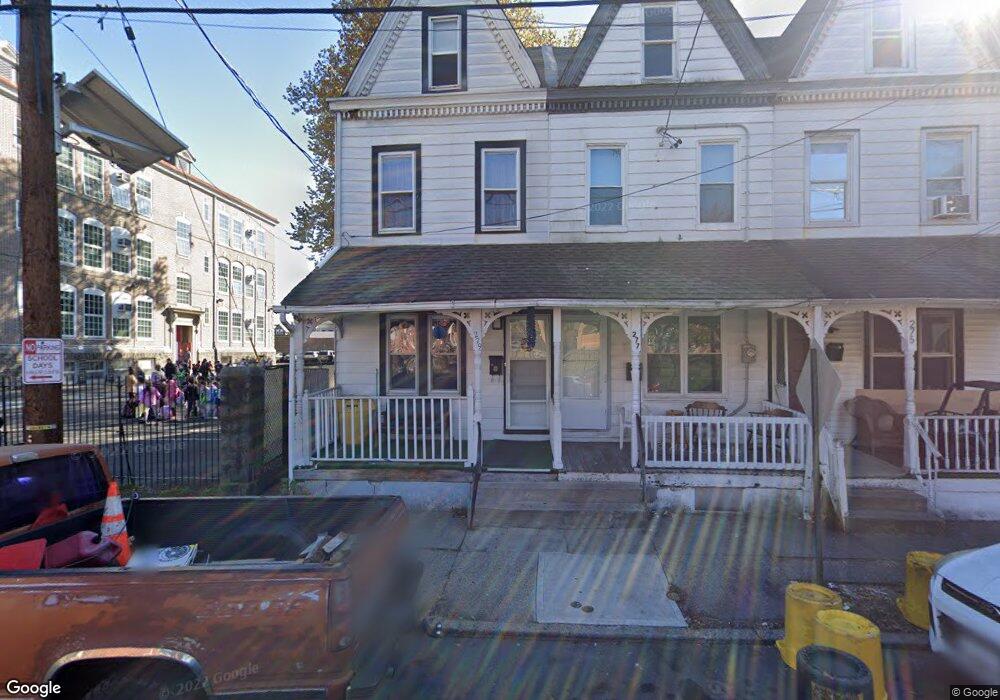
279 Tyler St Trenton, NJ 08609
Greenwood & Hamilton NeighborhoodEstimated Value: $185,000 - $254,000
4
Beds
2
Baths
1,300
Sq Ft
$160/Sq Ft
Est. Value
About This Home
This home is located at 279 Tyler St, Trenton, NJ 08609 and is currently estimated at $208,063, approximately $160 per square foot. 279 Tyler St is a home located in Mercer County with nearby schools including Robbins Elementary School, Monument Elementary School, and Dr. Martin Luther King Middle School.
Ownership History
Date
Name
Owned For
Owner Type
Purchase Details
Closed on
Apr 14, 2010
Sold by
Federal Home Loan Mortgage Corporation
Bought by
Kozlov Andre and Pidzamkiv Ivan
Current Estimated Value
Purchase Details
Closed on
Feb 4, 2010
Sold by
Maier Adrian and Wells Fargo Bank Na
Bought by
Federal Home Loan Mortgage Corporation
Purchase Details
Closed on
May 24, 2004
Sold by
Rodriguez Luis
Bought by
Maier Adrian
Home Financials for this Owner
Home Financials are based on the most recent Mortgage that was taken out on this home.
Original Mortgage
$66,405
Interest Rate
6.03%
Create a Home Valuation Report for This Property
The Home Valuation Report is an in-depth analysis detailing your home's value as well as a comparison with similar homes in the area
Home Values in the Area
Average Home Value in this Area
Purchase History
| Date | Buyer | Sale Price | Title Company |
|---|---|---|---|
| Kozlov Andre | $25,000 | Fortune Title Agency Inc | |
| Federal Home Loan Mortgage Corporation | -- | None Available | |
| Maier Adrian | $69,900 | -- |
Source: Public Records
Mortgage History
| Date | Status | Borrower | Loan Amount |
|---|---|---|---|
| Previous Owner | Maier Adrian | $66,405 |
Source: Public Records
Tax History Compared to Growth
Tax History
| Year | Tax Paid | Tax Assessment Tax Assessment Total Assessment is a certain percentage of the fair market value that is determined by local assessors to be the total taxable value of land and additions on the property. | Land | Improvement |
|---|---|---|---|---|
| 2025 | $3,498 | $60,300 | $16,300 | $44,000 |
| 2024 | $3,357 | $60,300 | $16,300 | $44,000 |
| 2023 | $3,357 | $60,300 | $16,300 | $44,000 |
| 2022 | $3,291 | $60,300 | $16,300 | $44,000 |
| 2021 | $3,348 | $60,300 | $16,300 | $44,000 |
| 2020 | $3,338 | $60,300 | $16,300 | $44,000 |
| 2019 | $3,284 | $60,300 | $16,300 | $44,000 |
| 2018 | $3,143 | $60,300 | $16,300 | $44,000 |
| 2017 | $2,988 | $60,300 | $16,300 | $44,000 |
| 2016 | $3,279 | $57,000 | $11,800 | $45,200 |
| 2015 | $3,268 | $57,000 | $11,800 | $45,200 |
| 2014 | $3,252 | $57,000 | $11,800 | $45,200 |
Source: Public Records
Map
Nearby Homes