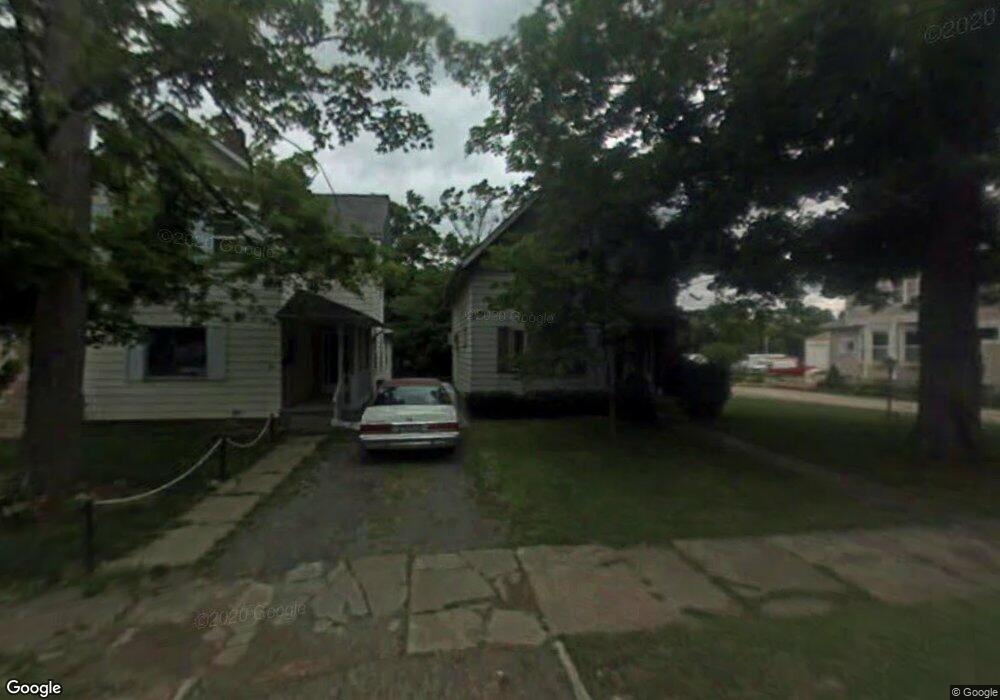
279 W Main St Alliance, OH 44601
Estimated Value: $88,809 - $117,000
2
Beds
1
Bath
1,350
Sq Ft
$71/Sq Ft
Est. Value
About This Home
This home is located at 279 W Main St, Alliance, OH 44601 and is currently estimated at $96,452, approximately $71 per square foot. 279 W Main St is a home located in Stark County with nearby schools including Alliance Early Learning School, Alliance Intermediate School at Northside, and Alliance Middle School.
Ownership History
Date
Name
Owned For
Owner Type
Purchase Details
Closed on
Nov 16, 2005
Sold by
Beltz Jennifer J and Beltz Charles A
Bought by
Acorn Rentals Ii Ltd
Current Estimated Value
Home Financials for this Owner
Home Financials are based on the most recent Mortgage that was taken out on this home.
Original Mortgage
$220,000
Outstanding Balance
$120,542
Interest Rate
6.04%
Mortgage Type
Purchase Money Mortgage
Estimated Equity
-$24,090
Purchase Details
Closed on
Nov 9, 2001
Sold by
Ingrid Mckee and Ingrid Foith
Bought by
Beltz Jennifer J
Home Financials for this Owner
Home Financials are based on the most recent Mortgage that was taken out on this home.
Original Mortgage
$25,534
Interest Rate
6.72%
Mortgage Type
Purchase Money Mortgage
Purchase Details
Closed on
Oct 9, 2000
Sold by
Elsa Mckee and Elsa E
Bought by
Foith Ingrid and Mckee Alexander
Create a Home Valuation Report for This Property
The Home Valuation Report is an in-depth analysis detailing your home's value as well as a comparison with similar homes in the area
Home Values in the Area
Average Home Value in this Area
Purchase History
| Date | Buyer | Sale Price | Title Company |
|---|---|---|---|
| Acorn Rentals Ii Ltd | -- | -- | |
| Beltz Jennifer J | $33,000 | -- | |
| Foith Ingrid | -- | -- |
Source: Public Records
Mortgage History
| Date | Status | Borrower | Loan Amount |
|---|---|---|---|
| Open | Acorn Rentals Ii Ltd | $220,000 | |
| Previous Owner | Beltz Jennifer J | $25,534 |
Source: Public Records
Tax History
| Year | Tax Paid | Tax Assessment Tax Assessment Total Assessment is a certain percentage of the fair market value that is determined by local assessors to be the total taxable value of land and additions on the property. | Land | Improvement |
|---|---|---|---|---|
| 2025 | -- | $25,660 | $6,790 | $18,870 |
| 2024 | -- | $25,660 | $6,790 | $18,870 |
| 2023 | $605 | $14,700 | $6,720 | $7,980 |
| 2022 | $609 | $14,700 | $6,720 | $7,980 |
| 2021 | $611 | $14,700 | $6,720 | $7,980 |
| 2020 | $604 | $13,590 | $5,850 | $7,740 |
| 2019 | $596 | $13,590 | $5,850 | $7,740 |
| 2018 | $599 | $13,590 | $5,850 | $7,740 |
| 2017 | $442 | $9,840 | $3,960 | $5,880 |
| 2016 | $445 | $9,840 | $3,960 | $5,880 |
| 2015 | $382 | $8,370 | $3,960 | $4,410 |
| 2014 | $428 | $8,930 | $4,200 | $4,730 |
| 2013 | $214 | $8,930 | $4,200 | $4,730 |
Source: Public Records
Map
Nearby Homes
- 33 S Lincoln Ave
- 264 W Market St
- 171 1/2 W Main St
- 163 W Market St
- 118 S Mckinley Ave
- 343 W Columbia St
- 479 W High St
- 319 W Oxford St
- 228 W Oxford St
- 62 E Market St
- 233 W Cambridge St
- 535 S Mckinley Ave
- 427 S Union Ave
- 621 S Haines Ave
- 505 N Union Ave
- 160 Bonnieview Ave
- 717 Garfield Ave
- 710 N Freedom Ave
- 361 E Main St
- 347 Buckeye Ave
Your Personal Tour Guide
Ask me questions while you tour the home.