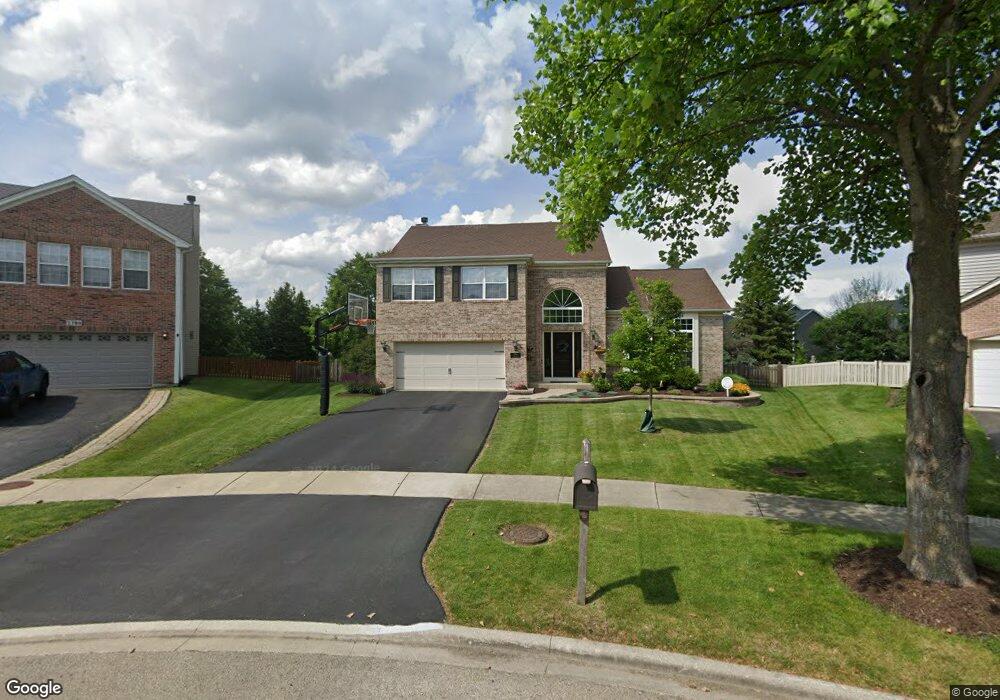
2790 Cavalcade Ct Aurora, IL 60503
Far Southeast NeighborhoodEstimated Value: $481,000 - $504,000
3
Beds
3
Baths
2,284
Sq Ft
$216/Sq Ft
Est. Value
About This Home
This home is located at 2790 Cavalcade Ct, Aurora, IL 60503 and is currently estimated at $494,000, approximately $216 per square foot. 2790 Cavalcade Ct is a home located in Will County with nearby schools including Homestead Elementary School, Murphy Junior High School, and Oswego East High School.
Ownership History
Date
Name
Owned For
Owner Type
Purchase Details
Closed on
Aug 30, 2005
Sold by
Sienkiewicz Jaroslaw and Keyvan Mahnaz R
Bought by
Lyzun Michael S and Lyzun Shelby
Current Estimated Value
Home Financials for this Owner
Home Financials are based on the most recent Mortgage that was taken out on this home.
Original Mortgage
$248,000
Outstanding Balance
$128,653
Interest Rate
5.37%
Mortgage Type
Purchase Money Mortgage
Estimated Equity
$365,347
Purchase Details
Closed on
Jul 27, 2000
Sold by
Richard Smykal Inc
Bought by
Sienkiewicz Jaroslaw and Koyvan Mahnaz R
Home Financials for this Owner
Home Financials are based on the most recent Mortgage that was taken out on this home.
Original Mortgage
$175,800
Interest Rate
7.87%
Create a Home Valuation Report for This Property
The Home Valuation Report is an in-depth analysis detailing your home's value as well as a comparison with similar homes in the area
Home Values in the Area
Average Home Value in this Area
Purchase History
We collect this data history from publicly available records. To have your information removed, we recommend requesting removal directly through your county’s website.
| Date | Buyer | Sale Price | Title Company |
|---|---|---|---|
| Lyzun Michael S | $313,000 | Lawyers Title Ins | |
| Sienkiewicz Jaroslaw | $220,500 | Chicago Title Insurance Co |
Source: Public Records
Mortgage History
We collect this data history from publicly available records. To have your information removed, we recommend requesting removal directly through your county’s website.
| Date | Status | Borrower | Loan Amount |
|---|---|---|---|
| Open | Lyzun Michael S | $248,000 | |
| Previous Owner | Sienkiewicz Jaroslaw | $175,800 |
Source: Public Records
Tax History
| Year | Tax Paid | Tax Assessment Tax Assessment Total Assessment is a certain percentage of the fair market value that is determined by local assessors to be the total taxable value of land and additions on the property. | Land | Improvement |
|---|---|---|---|---|
| 2024 | $10,637 | $123,211 | $23,259 | $99,952 |
| 2023 | $10,042 | $108,844 | $20,547 | $88,297 |
| 2022 | $10,093 | $107,417 | $19,437 | $87,980 |
| 2021 | $10,031 | $102,301 | $18,511 | $83,790 |
| 2020 | $9,604 | $100,680 | $18,218 | $82,462 |
| 2019 | $10,028 | $97,843 | $17,705 | $80,138 |
| 2018 | $9,387 | $89,045 | $17,315 | $71,730 |
| 2017 | $9,305 | $86,746 | $16,868 | $69,878 |
| 2016 | $9,218 | $84,879 | $16,505 | $68,374 |
| 2015 | $9,913 | $81,614 | $15,870 | $65,744 |
| 2014 | $9,913 | $81,550 | $21,000 | $60,550 |
| 2013 | $9,913 | $81,550 | $21,000 | $60,550 |
Source: Public Records
Map
Nearby Homes
- 1948 Barrington Ct
- 3383 Fulshear Cir
- 3379 Fulshear Cir
- 2233 Hillsboro Ct
- 3288 Wildlight Rd
- 3102 Adelwood Cir
- 2578 Hillsboro Blvd
- 2255 Georgetown Cir
- 1972 Middlebury Dr Unit 626
- 2495 Hafenrichter Rd
- 3264 Oak Creek Ln
- 3252 Oak Creek Ln
- 1767 Delta Dr
- 3160 Cambria Ct Unit 413
- 4467 Monroe Ct
- 2509 Rosehall Ln
- 2727 Northmoor Dr
- 2682 Avondale Cir
- 10140 S Eola Rd
- 2925 Madison Dr
- 2021 Whitethorn Dr
- 2017 Whitethorn Dr
- 2025 Whitethorn Dr
- 2791 Cavalcade Ct
- 2013 Whitethorn Dr
- 2029 Whitethorn Dr
- 2781 Cavalcade Ct
- 2022 Whitethorn Dr
- 2018 Whitethorn Dr
- 2009 Whitethorn Dr
- 2046 Whitethorn Dr
- 2014 Whitethorn Dr
- 2780 Cavalcade Ct
- 2771 Cavalcade Ct
- 2033 Whitethorn Dr
- 2010 Whitethorn Dr
- 2005 Whitethorn Dr
- 2770 Cavalcade Ct
- 2761 Cavalcade Ct
- 2037 Whitethorn Dr
Your Personal Tour Guide
Ask me questions while you tour the home.