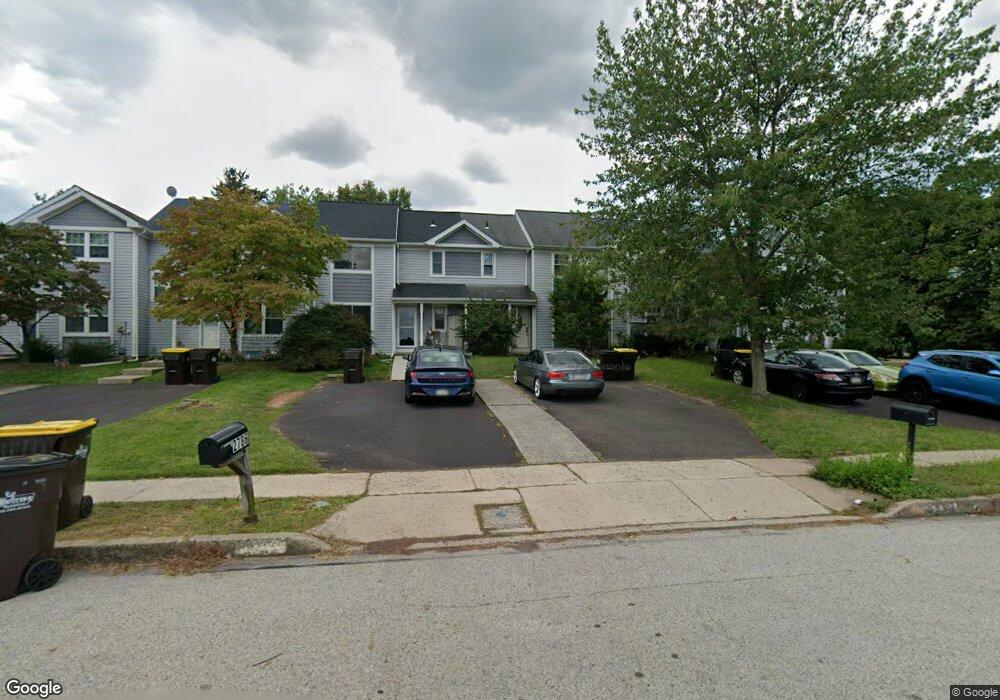
2790 Jean Dr Hatfield, PA 19440
Estimated Value: $312,000 - $363,000
3
Beds
2
Baths
1,292
Sq Ft
$268/Sq Ft
Est. Value
About This Home
This home is located at 2790 Jean Dr, Hatfield, PA 19440 and is currently estimated at $346,149, approximately $267 per square foot. 2790 Jean Dr is a home located in Montgomery County with nearby schools including Hatfield Elementary School, Pennfield Middle School, and North Penn Senior High School.
Ownership History
Date
Name
Owned For
Owner Type
Purchase Details
Closed on
Oct 11, 2024
Sold by
Elabd Meme and Dahab Ellia N
Bought by
Dahab Meme A
Current Estimated Value
Home Financials for this Owner
Home Financials are based on the most recent Mortgage that was taken out on this home.
Original Mortgage
$204,500
Outstanding Balance
$202,350
Interest Rate
6.35%
Mortgage Type
New Conventional
Estimated Equity
$143,799
Purchase Details
Closed on
Oct 8, 2009
Sold by
Baker Ronald J
Bought by
Elabd Meme and Dahab Ellia N
Home Financials for this Owner
Home Financials are based on the most recent Mortgage that was taken out on this home.
Original Mortgage
$16,164
Interest Rate
5.09%
Purchase Details
Closed on
Jul 29, 2003
Sold by
Trail Brian R
Bought by
Baker Ronald J
Create a Home Valuation Report for This Property
The Home Valuation Report is an in-depth analysis detailing your home's value as well as a comparison with similar homes in the area
Home Values in the Area
Average Home Value in this Area
Purchase History
| Date | Buyer | Sale Price | Title Company |
|---|---|---|---|
| Dahab Meme A | $71,732 | Mortgage Connect | |
| Dahab Meme A | $71,732 | Mortgage Connect | |
| Dahab Meme A | $71,732 | Mortgage Connect | |
| Elabd Meme | $195,000 | None Available | |
| Baker Ronald J | $151,500 | -- |
Source: Public Records
Mortgage History
| Date | Status | Borrower | Loan Amount |
|---|---|---|---|
| Open | Dahab Meme A | $204,500 | |
| Closed | Dahab Meme A | $204,500 | |
| Previous Owner | Elabd Meme | $16,164 |
Source: Public Records
Tax History Compared to Growth
Tax History
| Year | Tax Paid | Tax Assessment Tax Assessment Total Assessment is a certain percentage of the fair market value that is determined by local assessors to be the total taxable value of land and additions on the property. | Land | Improvement |
|---|---|---|---|---|
| 2025 | $3,949 | $98,660 | $31,040 | $67,620 |
| 2024 | $3,949 | $98,660 | $31,040 | $67,620 |
| 2023 | $3,780 | $98,660 | $31,040 | $67,620 |
| 2022 | $3,657 | $98,660 | $31,040 | $67,620 |
| 2021 | $3,553 | $98,660 | $31,040 | $67,620 |
| 2020 | $3,469 | $98,660 | $31,040 | $67,620 |
| 2019 | $3,412 | $98,660 | $31,040 | $67,620 |
| 2018 | $3,411 | $98,660 | $31,040 | $67,620 |
| 2017 | $3,281 | $98,660 | $31,040 | $67,620 |
| 2016 | $3,242 | $98,660 | $31,040 | $67,620 |
| 2015 | $3,187 | $98,660 | $31,040 | $67,620 |
| 2014 | $3,113 | $98,660 | $31,040 | $67,620 |
Source: Public Records
Map
Nearby Homes
- 2634 Jean Dr
- 829 Alexander Dr
- 1520 Fairgrounds Rd
- 2821 N Ford Dr
- 2805 N Ford Dr
- 701 Quail Cir
- 2801 Denbeigh Dr
- 3113 Arbour Green Ct
- 302 W Broad St
- 2921 Cowpath Rd
- 24 S Wayne Ave
- 2031 Oak Ave
- 142 Orchard Ln
- 113 Hickory Dr
- 2713 Beech St
- 109 Hickory Dr
- 1095 Owen Ln
- 105 S Main St
- 138 Diamond St Unit 31
- 480 Bentwood Dr
- 2794 Jean Dr
- 2786 Jean Dr
- 2782 Jean Dr
- 2798 Jean Dr
- 2778 Jean Dr
- 2766 Jean Dr
- 1361 Fairgrounds Rd
- 2762 Jean Dr
- 2758 Jean Dr
- 1360 Providence Ln
- 2754 Jean Dr
- 1365 Fairgrounds Rd
- 2750 Jean Dr
- 1364 Providence Ln
- 2746 Jean Dr
- 1368 Providence Ln
- 1373 Fairgrounds Rd
- 2734 Jean Dr
- 1318 Fairgrounds Rd
- 1372 Providence Ln