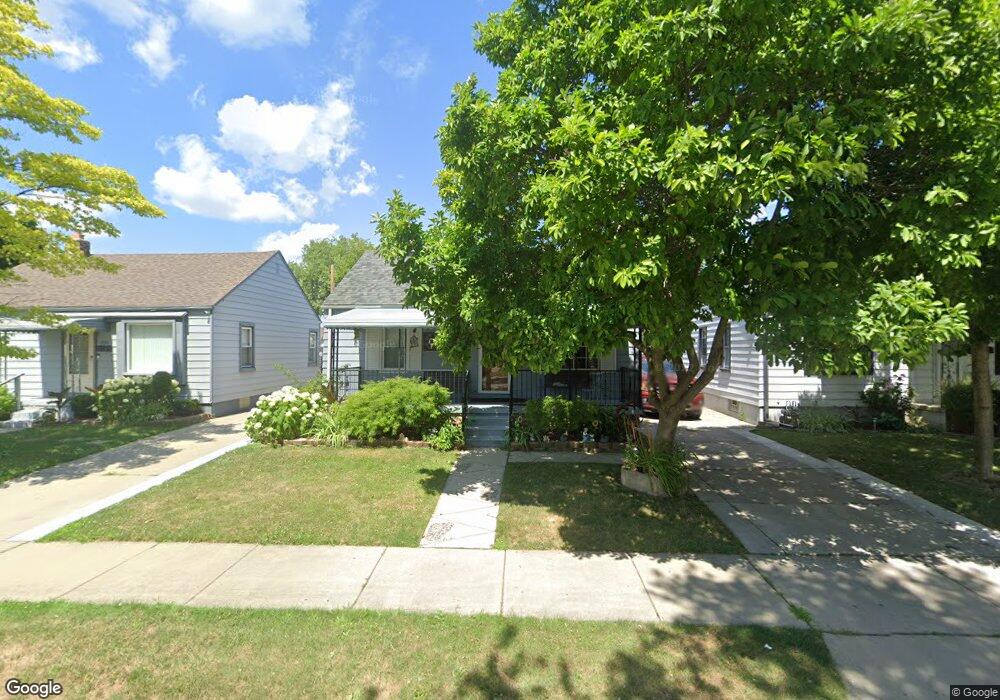
2790 Norman St Melvindale, MI 48122
Estimated Value: $106,000 - $121,000
2
Beds
1
Bath
725
Sq Ft
$160/Sq Ft
Est. Value
About This Home
This home is located at 2790 Norman St, Melvindale, MI 48122 and is currently estimated at $116,062, approximately $160 per square foot. 2790 Norman St is a home located in Wayne County with nearby schools including Rogers Early Elementary School, Allendale Elementary School, and Julian O. Strong Middle School.
Ownership History
Date
Name
Owned For
Owner Type
Purchase Details
Closed on
Aug 14, 2024
Sold by
Tapia Gustavo
Bought by
Tapia Angelica
Current Estimated Value
Purchase Details
Closed on
May 12, 2009
Sold by
Rico Camilo and Tapia Olivia
Bought by
Tapia Gustavo
Purchase Details
Closed on
Jul 31, 2008
Sold by
Novastar Mortgage Inc
Bought by
The Bank Of New York Mellon and Novastar Mortgage Funding Trust 2005-1
Purchase Details
Closed on
Mar 26, 2008
Sold by
Quick Jacqueline S and Quick Kennith D
Bought by
Novastar Mortgage Inc
Purchase Details
Closed on
Jan 26, 2005
Sold by
Jaeger Jacqueline S and Jaeger Jacqueline
Bought by
Quick Kenneth D
Home Financials for this Owner
Home Financials are based on the most recent Mortgage that was taken out on this home.
Original Mortgage
$74,500
Interest Rate
9.95%
Mortgage Type
Purchase Money Mortgage
Purchase Details
Closed on
Jan 26, 1998
Sold by
Elizabeth M and Elizabeth Garnett L
Bought by
Jaeger Jacqueline S
Create a Home Valuation Report for This Property
The Home Valuation Report is an in-depth analysis detailing your home's value as well as a comparison with similar homes in the area
Home Values in the Area
Average Home Value in this Area
Purchase History
| Date | Buyer | Sale Price | Title Company |
|---|---|---|---|
| Tapia Angelica | -- | Minnesota Title Agency | |
| Tapia Gustavo | -- | Minnesota Title Agency | |
| The Bank Of New York Mellon | -- | E Title Agency | |
| Novastar Mortgage Inc | $57,800 | None Available | |
| Quick Kenneth D | -- | -- | |
| Jaeger Jacqueline S | $48,000 | -- |
Source: Public Records
Mortgage History
| Date | Status | Borrower | Loan Amount |
|---|---|---|---|
| Previous Owner | Quick Kenneth D | $74,500 |
Source: Public Records
Tax History
| Year | Tax Paid | Tax Assessment Tax Assessment Total Assessment is a certain percentage of the fair market value that is determined by local assessors to be the total taxable value of land and additions on the property. | Land | Improvement |
|---|---|---|---|---|
| 2025 | $936 | $58,800 | $0 | $0 |
| 2024 | $909 | $50,300 | $0 | $0 |
| 2023 | $866 | $44,000 | $0 | $0 |
| 2022 | $1,683 | $39,500 | $0 | $0 |
| 2021 | $1,631 | $35,300 | $0 | $0 |
| 2020 | $1,625 | $27,800 | $0 | $0 |
| 2019 | $1,507 | $24,100 | $0 | $0 |
| 2018 | $901 | $23,700 | $0 | $0 |
| 2017 | $1,118 | $24,000 | $0 | $0 |
| 2016 | $1,428 | $22,700 | $0 | $0 |
| 2015 | $2,073 | $20,800 | $0 | $0 |
| 2013 | $2,020 | $21,200 | $0 | $0 |
| 2012 | $949 | $20,600 | $3,100 | $17,500 |
Source: Public Records
Map
Nearby Homes
- 2735 Margaret St
- 2573 Grace St
- 19120 Dix Rd
- 19305 Wall St
- 19238 Harlow St
- 000 Harlow St
- 19504 Roger St
- 3603 Harlow Ave
- 18666 Reed St
- 24558 Outer Dr
- 1862 Montie Rd
- 0002 Prospect St
- 0001 Prospect St
- 1836 Reo Ave
- 17951 Prospect St
- 2190 Morris Ave
- 2091 Morris Ave
- 2065 Morris Ave
- 3511 Elizabeth St
- 18634 Wood St
- 2798 Norman St
- 2782 Norman St
- 2774 Norman St
- 2808 Norman St
- 2764 Norman St
- 2791 Margaret St
- 2801 Margaret St
- 2785 Margaret St
- 2760 Norman St
- 2775 Margaret St
- 2791 Norman St
- 2801 Norman St
- 2783 Norman St
- 2775 Norman St
- 2767 Margaret St
- 2809 Norman St
- 2752 Norman St
- 2767 Norman St
- 2761 Margaret St
- 2761 Norman St