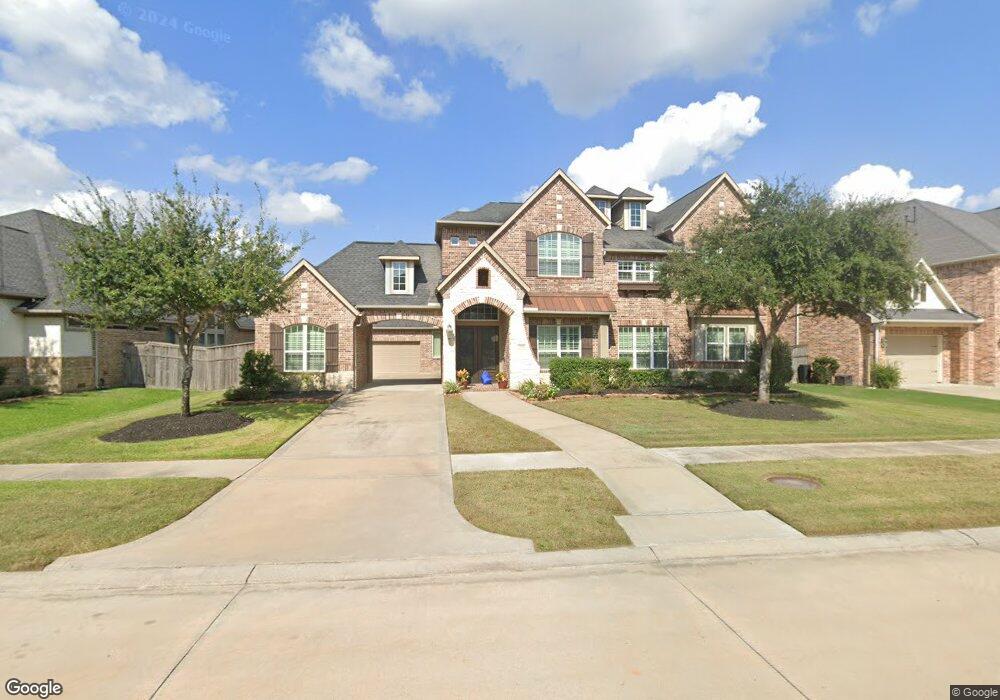
27914 Burnett Hills Ln Fulshear, TX 77441
Cross Creek Ranch NeighborhoodEstimated Value: $1,018,488 - $1,241,000
5
Beds
5
Baths
4,637
Sq Ft
$233/Sq Ft
Est. Value
About This Home
This home is located at 27914 Burnett Hills Ln, Fulshear, TX 77441 and is currently estimated at $1,080,122, approximately $232 per square foot. 27914 Burnett Hills Ln is a home with nearby schools including James E. Randolph Elementary School, Joe M. Adams Junior High, and Sugar Creek Montessori - Fulshear/West Katy.
Ownership History
Date
Name
Owned For
Owner Type
Purchase Details
Closed on
Apr 27, 2015
Sold by
Trendmarker Homes Inc
Bought by
Clark Kevin Lamond and Clark Remona L
Current Estimated Value
Home Financials for this Owner
Home Financials are based on the most recent Mortgage that was taken out on this home.
Original Mortgage
$553,128
Outstanding Balance
$428,569
Interest Rate
3.84%
Mortgage Type
New Conventional
Estimated Equity
$651,553
Purchase Details
Closed on
Aug 14, 2014
Sold by
Ccr Loan Subsidiary 1 Lp
Bought by
Clark Kevin Lamond and Clark Remona L
Purchase Details
Closed on
Aug 13, 2014
Sold by
Ccr Loan Subsidiary 1 Lp
Bought by
Trendmaker Homes Inc
Purchase Details
Closed on
Sep 19, 2013
Sold by
Ccr Loan Subsidiary 1 Lp
Bought by
Clark Kevin Lamond and Clark Remona L
Create a Home Valuation Report for This Property
The Home Valuation Report is an in-depth analysis detailing your home's value as well as a comparison with similar homes in the area
Home Values in the Area
Average Home Value in this Area
Purchase History
| Date | Buyer | Sale Price | Title Company |
|---|---|---|---|
| Clark Kevin Lamond | -- | First American Title | |
| Clark Kevin Lamond | -- | -- | |
| Trendmaker Homes Inc | -- | Chicago Title Park Ten | |
| Clark Kevin Lamond | -- | -- |
Source: Public Records
Mortgage History
| Date | Status | Borrower | Loan Amount |
|---|---|---|---|
| Open | Clark Kevin Lamond | $553,128 |
Source: Public Records
Tax History Compared to Growth
Tax History
| Year | Tax Paid | Tax Assessment Tax Assessment Total Assessment is a certain percentage of the fair market value that is determined by local assessors to be the total taxable value of land and additions on the property. | Land | Improvement |
|---|---|---|---|---|
| 2025 | $13,564 | $946,241 | $153,842 | $792,399 |
| 2024 | $13,564 | $867,352 | $71,928 | $795,424 |
| 2023 | $19,077 | $788,502 | $0 | $796,281 |
| 2022 | $20,001 | $716,820 | $2,070 | $714,750 |
| 2021 | $20,446 | $651,650 | $118,340 | $533,310 |
| 2020 | $20,320 | $627,340 | $108,020 | $519,320 |
| 2019 | $19,703 | $578,970 | $108,020 | $470,950 |
| 2018 | $19,512 | $568,990 | $108,020 | $460,970 |
| 2017 | $19,990 | $577,330 | $108,020 | $469,310 |
| 2016 | $20,410 | $589,470 | $108,020 | $481,450 |
| 2015 | $7,328 | $323,650 | $88,160 | $235,490 |
| 2014 | -- | $64,960 | $64,960 | $0 |
Source: Public Records
Map
Nearby Homes
- 5310 Briarcliff Ln
- 5303 Briarcliff Ln
- 32919 Southern Manors Dr
- 5815 Mustang Ridge Ln
- 5102 Kendalia Cloud Ln
- 28103 Lockridge Ct
- 5607 Mustang Ridge Ln
- 5431 Caspian Falls Ln
- 5122 Bartlett Vista Ct
- 27919 Starlight Harbor Ln
- 5615 Caspian Falls Ln
- 5710 Spring River Ln
- 5719 Spring River Ln
- 27602 Balcones Heights Blvd
- 5603 Avis Hill Ct
- 28518 Hoffman Spring Ln
- 27714 Wimberly Falls Ln
- 4915 Medina Bend Ln
- 6110 Chapel Falls Ln
- 28215 Goose Creek Ct
- 27910 Burnett Hills Ln
- 27918 Burnett Hills Ln
- 27906 Burnett Hills Ln
- 27922 Burnett Hills Ln
- 5302 Austin Springs Ct
- 5303 Austin Springs Ct
- 5302 Austin Springs
- 5307 Austin Springs Ct
- 27902 Burnett Hills Ln
- 5306 Austin Springs Ct
- 27926 Burnett Hills Ln
- 5426 Briarcliff Ln
- 5418 Briarcliff Ln
- 5310 Austin Springs Ct
- 5302 Briarcliff Ln
- 27826 Burnett Hills Ln
- 28002 Burnett Hills Ln
- 5410 Briarcliff Ln
- 27822 Burnett Hills Ln
- 5402 Briarcliff Ln