Estimated Value: $472,531 - $485,000
4
Beds
3
Baths
2,172
Sq Ft
$220/Sq Ft
Est. Value
About This Home
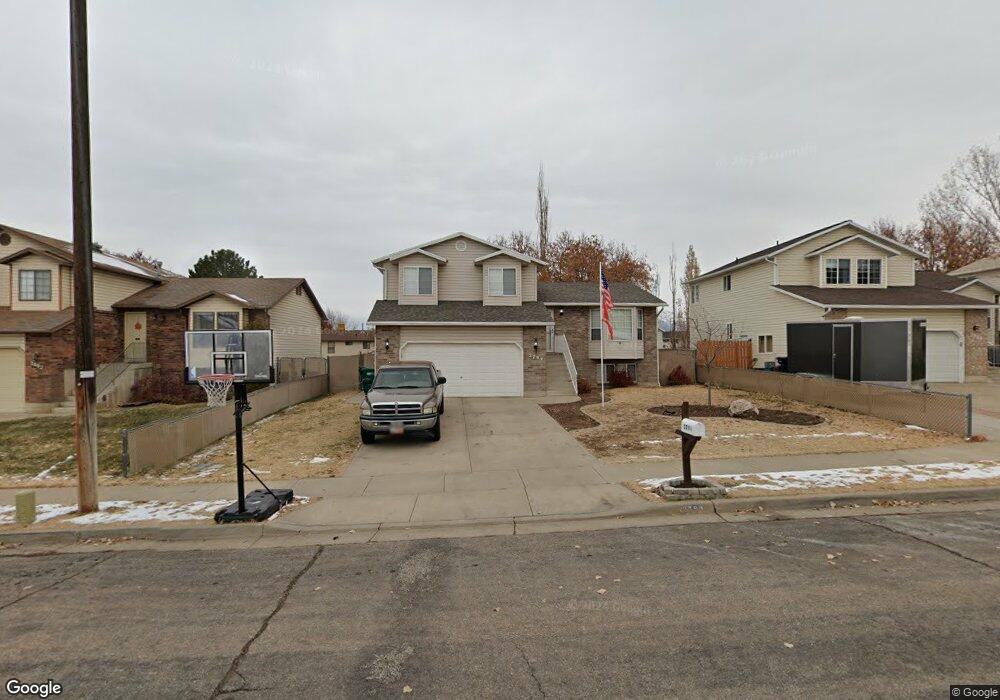
This home is located at 2794 W 4400 S, Roy, UT 84067 and is currently estimated at $478,133, approximately $220 per square foot. 2794 W 4400 S is a home located in Weber County with nearby schools including Midland School, Sand Ridge Junior High School, and Roy High School.
Ownership History
Date
Name
Owned For
Owner Type
Purchase Details
Closed on
Mar 17, 2020
Sold by
Rasmussen Sydney T
Bought by
Pentecost John and Pentecost Lindsay
Current Estimated Value
Home Financials for this Owner
Home Financials are based on the most recent Mortgage that was taken out on this home.
Original Mortgage
$305,550
Outstanding Balance
$270,092
Interest Rate
3.4%
Mortgage Type
New Conventional
Estimated Equity
$208,041
Purchase Details
Closed on
Dec 22, 2016
Sold by
Endo Byron D
Bought by
Rasussen Sydney T
Home Financials for this Owner
Home Financials are based on the most recent Mortgage that was taken out on this home.
Original Mortgage
$193,000
Interest Rate
3.57%
Mortgage Type
New Conventional
Purchase Details
Closed on
Sep 13, 2006
Sold by
Doman Beverly A
Bought by
Endo Byron D
Home Financials for this Owner
Home Financials are based on the most recent Mortgage that was taken out on this home.
Original Mortgage
$157,700
Interest Rate
6.56%
Mortgage Type
Purchase Money Mortgage
Create a Home Valuation Report for This Property
The Home Valuation Report is an in-depth analysis detailing your home's value as well as a comparison with similar homes in the area
Home Values in the Area
Average Home Value in this Area
Purchase History
We collect this data history from publicly available records. To have your information removed, we recommend requesting removal directly through your county’s website.
| Date | Buyer | Sale Price | Title Company |
|---|---|---|---|
| Pentecost John | -- | Us Title Insurance Agency | |
| Rasussen Sydney T | -- | None Available | |
| Endo Byron D | -- | First American Title |
Source: Public Records
Mortgage History
We collect this data history from publicly available records. To have your information removed, we recommend requesting removal directly through your county’s website.
| Date | Status | Borrower | Loan Amount |
|---|---|---|---|
| Open | Pentecost John | $305,550 | |
| Previous Owner | Rasussen Sydney T | $193,000 | |
| Previous Owner | Endo Byron D | $157,700 |
Source: Public Records
Tax History
| Year | Tax Paid | Tax Assessment Tax Assessment Total Assessment is a certain percentage of the fair market value that is determined by local assessors to be the total taxable value of land and additions on the property. | Land | Improvement |
|---|---|---|---|---|
| 2025 | $2,780 | $443,650 | $130,015 | $313,635 |
| 2024 | $2,713 | $239,799 | $71,508 | $168,291 |
| 2023 | $2,543 | $224,400 | $71,317 | $153,083 |
| 2022 | $2,633 | $239,800 | $60,501 | $179,299 |
| 2021 | $2,258 | $339,000 | $75,002 | $263,998 |
| 2020 | $2,106 | $290,000 | $75,002 | $214,998 |
| 2019 | $2,044 | $265,000 | $44,976 | $220,024 |
| 2018 | $1,936 | $236,000 | $44,976 | $191,024 |
| 2017 | $1,886 | $216,000 | $43,029 | $172,971 |
| 2016 | $1,693 | $103,332 | $24,773 | $78,559 |
| 2015 | $1,515 | $94,089 | $24,773 | $69,316 |
| 2014 | $1,473 | $90,233 | $24,773 | $65,460 |
Source: Public Records
Map
Nearby Homes
- 4371 S 2900 W
- 2778 W 4175 S Unit 237
- 2782 W 4140 S Unit 249
- 4108 S 2835 W Unit 318
- 4108 S 2835 W Unit 317
- 4108 S 2835 W Unit 319
- 4108 S 2835 W Unit 320
- 2848 W 4075 S Unit 315
- 2848 W 4075 S Unit 316
- 2848 W 4075 S Unit 314
- 3004 W 4650 S
- 3080 W 4600 S
- 4275 S 2400 W
- 283 3800 S 1900 W #283 Unit 283
- 229 3800 S 1900 W Unit 229
- 4020 Westlake Dr
- 2672 W 3950 S
- 3922 S 2950 W
- 4302 S 2325 W
- 4164 S 2400 W
Your Personal Tour Guide
Ask me questions while you tour the home.