Estimated Value: $387,000 - $452,000
4
Beds
2
Baths
1,922
Sq Ft
$221/Sq Ft
Est. Value
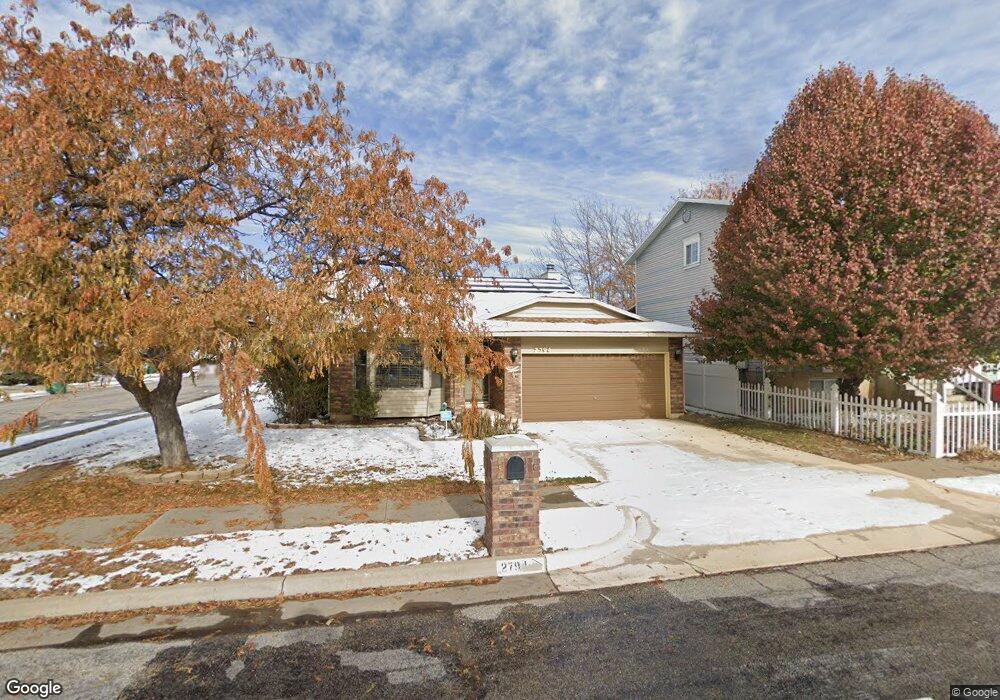
About This Home
This home is located at 2794 W 5325 S, Roy, UT 84067 and is currently estimated at $424,333, approximately $220 per square foot. 2794 W 5325 S is a home located in Weber County with nearby schools including Roy Elementary School, Roy Junior High School, and Roy High School.
Ownership History
Date
Name
Owned For
Owner Type
Purchase Details
Closed on
Jun 13, 2024
Sold by
Mike Bowman Real Estate Inc
Bought by
Swenson Kaedon N and Khan Mareen S
Current Estimated Value
Home Financials for this Owner
Home Financials are based on the most recent Mortgage that was taken out on this home.
Original Mortgage
$26,170
Outstanding Balance
$25,826
Interest Rate
7.22%
Estimated Equity
$398,507
Purchase Details
Closed on
Jun 4, 2024
Sold by
Bodily Vicki P and Bodily Vicki J
Bought by
Mike Bowman Real Estate Inc
Home Financials for this Owner
Home Financials are based on the most recent Mortgage that was taken out on this home.
Original Mortgage
$26,170
Outstanding Balance
$25,826
Interest Rate
7.22%
Estimated Equity
$398,507
Purchase Details
Closed on
Feb 29, 2024
Sold by
Bodily Vicki J
Bought by
Mike Bowman Real Estate Inc
Purchase Details
Closed on
Sep 17, 2002
Sold by
Bodily Vicki P
Bought by
Bodily Vicki P and Peterson Stanley W
Create a Home Valuation Report for This Property
The Home Valuation Report is an in-depth analysis detailing your home's value as well as a comparison with similar homes in the area
Home Values in the Area
Average Home Value in this Area
Purchase History
| Date | Buyer | Sale Price | Title Company |
|---|---|---|---|
| Swenson Kaedon N | -- | Us Title Insurance Agency | |
| Mike Bowman Real Estate Inc | -- | Merakai Title | |
| Mike Bowman Real Estate Inc | -- | Meraki Title Insurance Agency | |
| Bodily Vicki P | -- | First American Title | |
| Bodily Vicki P | -- | First American Title |
Source: Public Records
Mortgage History
| Date | Status | Borrower | Loan Amount |
|---|---|---|---|
| Open | Swenson Kaedon N | $26,170 | |
| Open | Swenson Kaedon N | $443,813 |
Source: Public Records
Tax History
| Year | Tax Paid | Tax Assessment Tax Assessment Total Assessment is a certain percentage of the fair market value that is determined by local assessors to be the total taxable value of land and additions on the property. | Land | Improvement |
|---|---|---|---|---|
| 2025 | $2,284 | $356,146 | $104,151 | $251,995 |
| 2024 | $2,229 | $192,499 | $57,283 | $135,216 |
| 2023 | $2,346 | $205,150 | $54,959 | $150,191 |
| 2022 | $2,203 | $196,900 | $52,207 | $144,693 |
| 2021 | $1,907 | $281,000 | $53,380 | $227,620 |
| 2020 | $1,835 | $249,000 | $53,380 | $195,620 |
| 2019 | $1,715 | $218,000 | $43,522 | $174,478 |
| 2018 | $1,655 | $198,000 | $39,403 | $158,597 |
| 2017 | $1,462 | $162,000 | $39,403 | $122,597 |
| 2016 | $1,403 | $83,411 | $17,459 | $65,952 |
| 2015 | $1,297 | $78,643 | $17,459 | $61,184 |
| 2014 | $1,257 | $75,087 | $17,459 | $57,628 |
Source: Public Records
Map
Nearby Homes
Your Personal Tour Guide
Ask me questions while you tour the home.