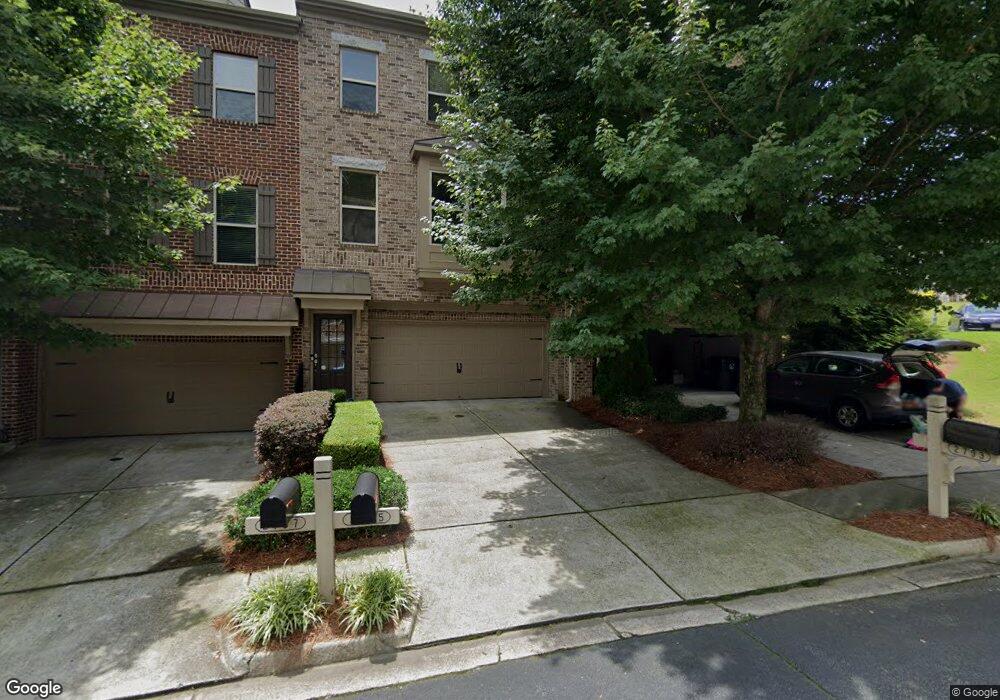
2795 Laurel Valley Trail Buford, GA 30519
Estimated Value: $377,611 - $404,000
4
Beds
4
Baths
1,788
Sq Ft
$217/Sq Ft
Est. Value
About This Home
This home is located at 2795 Laurel Valley Trail, Buford, GA 30519 and is currently estimated at $387,903, approximately $216 per square foot. 2795 Laurel Valley Trail is a home located in Gwinnett County with nearby schools including Rock Springs Elementary School, Creekland Middle School, and Collins Hill High School.
Ownership History
Date
Name
Owned For
Owner Type
Purchase Details
Closed on
Feb 23, 2019
Sold by
Foxx Ernest
Bought by
Foxx Ernest and Foxx Ebony S
Current Estimated Value
Home Financials for this Owner
Home Financials are based on the most recent Mortgage that was taken out on this home.
Original Mortgage
$219,678
Outstanding Balance
$194,186
Interest Rate
4.87%
Mortgage Type
FHA
Estimated Equity
$193,717
Purchase Details
Closed on
Dec 29, 2011
Sold by
Memon Properties Inc
Bought by
Foxx Ernest
Purchase Details
Closed on
Oct 4, 2011
Sold by
Kim Jeong
Bought by
Memon Properties Inc
Purchase Details
Closed on
Jul 31, 2007
Sold by
Paul Thomas Construction Llc
Bought by
Kim Jeong
Home Financials for this Owner
Home Financials are based on the most recent Mortgage that was taken out on this home.
Original Mortgage
$171,920
Interest Rate
8%
Mortgage Type
New Conventional
Create a Home Valuation Report for This Property
The Home Valuation Report is an in-depth analysis detailing your home's value as well as a comparison with similar homes in the area
Home Values in the Area
Average Home Value in this Area
Purchase History
| Date | Buyer | Sale Price | Title Company |
|---|---|---|---|
| Foxx Ernest | -- | -- | |
| Foxx Ernest | $127,750 | -- | |
| Memon Properties Inc | $89,201 | -- | |
| Kim Jeong | $214,500 | -- |
Source: Public Records
Mortgage History
| Date | Status | Borrower | Loan Amount |
|---|---|---|---|
| Open | Foxx Ernest | $219,678 | |
| Previous Owner | Kim Jeong | $171,920 |
Source: Public Records
Tax History Compared to Growth
Tax History
| Year | Tax Paid | Tax Assessment Tax Assessment Total Assessment is a certain percentage of the fair market value that is determined by local assessors to be the total taxable value of land and additions on the property. | Land | Improvement |
|---|---|---|---|---|
| 2025 | $5,708 | $163,000 | $24,000 | $139,000 |
| 2024 | $5,364 | $149,320 | $26,400 | $122,920 |
| 2023 | $5,364 | $140,560 | $26,400 | $114,160 |
| 2022 | $4,521 | $126,480 | $26,400 | $100,080 |
| 2021 | $3,609 | $99,240 | $18,400 | $80,840 |
| 2020 | $3,502 | $95,680 | $18,400 | $77,280 |
| 2019 | $3,380 | $95,680 | $18,400 | $77,280 |
| 2018 | $2,972 | $83,960 | $18,400 | $65,560 |
| 2016 | $2,782 | $77,960 | $17,440 | $60,520 |
| 2015 | $2,358 | $65,080 | $13,600 | $51,480 |
| 2014 | -- | $51,080 | $12,000 | $39,080 |
Source: Public Records
Map
Nearby Homes
- 1096 Rock Springs Rd
- 2940 Montague Place Dr
- 3080 Baymount Dr
- 990 Spring Brook Dr
- 975 Grace Dr
- 1375 Rock Springs Rd
- 842 Rockfount Way
- 3234 Baymount Way
- 2711 Bluffton Rd
- 1405 Rock Springs Rd
- 2700 Pierce Brennen Ct
- 2769 Springfount Trail
- 2759 Springfount Trail
- 3790 Salvia Dr
- 2852 Habibi Ct
- 2850 Habibi Ct
- 2793 Laurel Valley Trail
- 2799 Laurel Valley Trail Unit NAVLB
- 2799 Laurel Valley Trail
- 2801 Laurel Valley Trail
- 1146 Laurel Valley Ct Unit 73
- 1146 Laurel Valley Ct
- 1144 Laurel Valley Ct Unit 72
- 1144 Laurel Valley Ct
- 1148 Laurel Valley Ct Unit 74
- 1148 Laurel Valley Ct
- 1150 Laurel Valley Ct Unit 75
- 1150 Laurel Valley Ct
- 1142 Laurel Valley Ct Unit 71
- 1142 Laurel Valley Ct
- 2803 Laurel Valley Trail
- 1154 Laurel Valley Ct Unit 76
- 1154 Laurel Valley Ct
- 2796 Laurel Valley Trail Unit 21
- 2796 Laurel Valley Trail
- 2794 Laurel Valley Trail