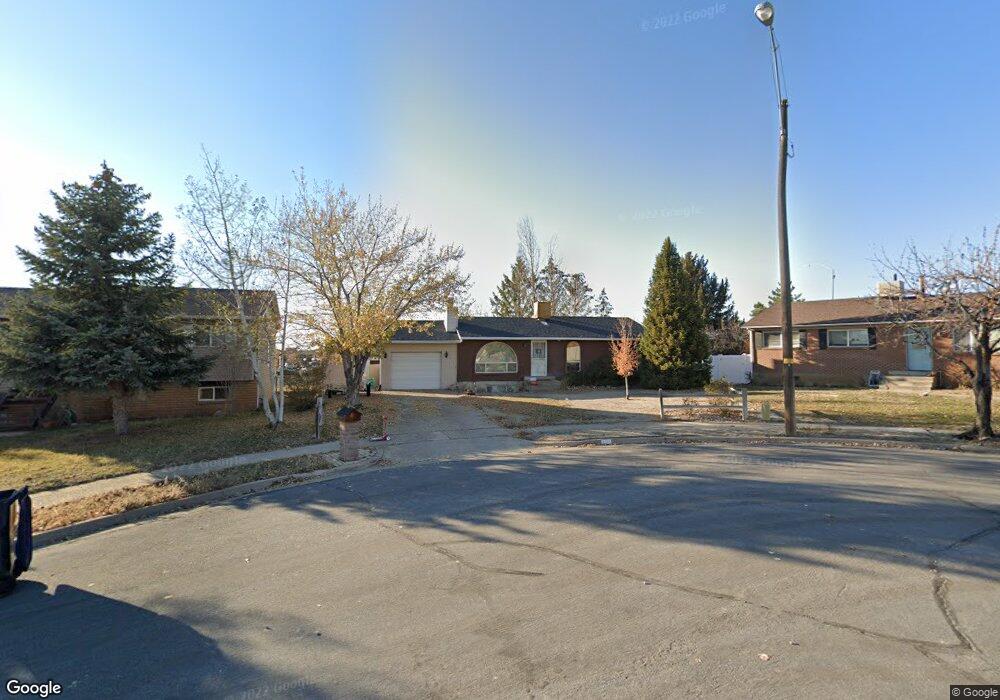
2795 N 1450 E Layton, UT 84040
Estimated Value: $447,000 - $472,000
4
Beds
3
Baths
2,169
Sq Ft
$214/Sq Ft
Est. Value
About This Home
This home is located at 2795 N 1450 E, Layton, UT 84040 and is currently estimated at $464,094, approximately $213 per square foot. 2795 N 1450 E is a home located in Davis County with nearby schools including Mountain View Elementary School, North Layton Junior High School, and Northridge High School.
Ownership History
Date
Name
Owned For
Owner Type
Purchase Details
Closed on
Oct 9, 2024
Sold by
Hummer Amber L
Bought by
Hummer David G
Current Estimated Value
Purchase Details
Closed on
Oct 15, 2021
Sold by
Mcbrayer Laura A and Mcbrayer Roger J
Bought by
Hummer David G and Hummer Amber L
Home Financials for this Owner
Home Financials are based on the most recent Mortgage that was taken out on this home.
Original Mortgage
$378,026
Interest Rate
2.8%
Mortgage Type
FHA
Purchase Details
Closed on
Dec 30, 2011
Sold by
Mcbrayer Roger J and Mcbrayer Laura A
Bought by
Mcbrayer Laura A and Mcbrayer Roger J
Home Financials for this Owner
Home Financials are based on the most recent Mortgage that was taken out on this home.
Original Mortgage
$64,500
Interest Rate
3.91%
Mortgage Type
New Conventional
Purchase Details
Closed on
Sep 6, 2006
Sold by
Mcbrayer Roger J
Bought by
Mcbrayer Roger J and Mcbrayer Laura A
Create a Home Valuation Report for This Property
The Home Valuation Report is an in-depth analysis detailing your home's value as well as a comparison with similar homes in the area
Home Values in the Area
Average Home Value in this Area
Purchase History
| Date | Buyer | Sale Price | Title Company |
|---|---|---|---|
| Hummer David G | -- | None Listed On Document | |
| Hummer David G | -- | First American Title | |
| Mcbrayer Laura A | -- | Hickman Land Title C | |
| Mcbrayer Roger J | -- | None Available |
Source: Public Records
Mortgage History
| Date | Status | Borrower | Loan Amount |
|---|---|---|---|
| Previous Owner | Hummer David G | $378,026 | |
| Previous Owner | Mcbrayer Laura A | $64,500 |
Source: Public Records
Tax History
| Year | Tax Paid | Tax Assessment Tax Assessment Total Assessment is a certain percentage of the fair market value that is determined by local assessors to be the total taxable value of land and additions on the property. | Land | Improvement |
|---|---|---|---|---|
| 2025 | $2,474 | $238,700 | $125,710 | $112,990 |
| 2024 | $2,350 | $229,900 | $149,331 | $80,569 |
| 2023 | $2,303 | $401,000 | $200,894 | $200,106 |
| 2022 | $2,391 | $227,700 | $107,799 | $119,901 |
| 2021 | $2,285 | $325,000 | $164,123 | $160,877 |
| 2020 | $2,015 | $274,000 | $133,143 | $140,857 |
| 2019 | $1,983 | $266,000 | $118,883 | $147,117 |
| 2018 | $1,796 | $242,000 | $77,471 | $164,529 |
| 2016 | $1,600 | $112,915 | $23,506 | $89,409 |
| 2015 | $1,503 | $101,035 | $23,506 | $77,529 |
| 2014 | $1,453 | $100,393 | $23,506 | $76,887 |
| 2013 | -- | $92,449 | $22,748 | $69,701 |
Source: Public Records
Map
Nearby Homes
- 1447 E 2700 N
- 2826 N 1600 E
- 1731 E 2825 N
- 1785 E 2825 N
- 1241 E 3075 N
- 1266 E 3125 N
- 3176 N 1450 E
- 1321 E 3125 N
- 3142 E Thorley Dr
- 3138 E Thorley Dr
- 1821 E Whitetail Way
- 1911 Deere Valley Dr
- 1827 E Whitetail Dr
- 1444 E 2400 N
- 948 E Hercules Ct Unit 179
- 1935 Deere Valley Dr
- 935 E 3000 N Unit 183
- 935 E 3000 N Unit 175
- 935 E 3000 N Unit 165
- 935 E 3000 N Unit 26
- 2793 N 1450 E
- 2797 N 1450 E
- 1455 E 2800 N
- 2789 N 1450 E
- 1459 E 2800 N
- 2777 N 1450 E
- 1468 E 2800 N
- 1200 N Church St Unit 16
- 1200 N Church St Unit 60
- 1351 N Church St
- 948 N Church St
- 1157 N Church St
- 2784 N 1450 E
- 1471 E 2800 N
- 2753 N 1450 E
- 2768 N 1450 E
- 2783 N 1525 E
- 1495 E 2800 N
- 2769 N 1525 E
- 2731 N 1450 E
Your Personal Tour Guide
Ask me questions while you tour the home.