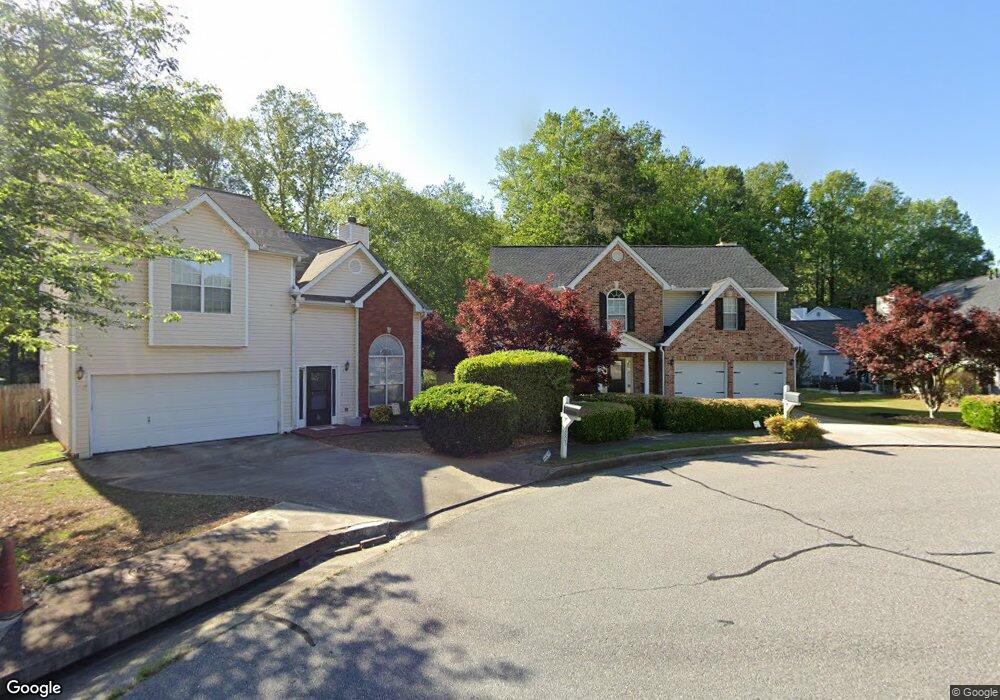
2795 Nesbitt Crossing Way Duluth, GA 30096
Estimated Value: $467,000 - $518,000
4
Beds
3
Baths
2,471
Sq Ft
$198/Sq Ft
Est. Value
About This Home
This home is located at 2795 Nesbitt Crossing Way, Duluth, GA 30096 and is currently estimated at $488,847, approximately $197 per square foot. 2795 Nesbitt Crossing Way is a home located in Gwinnett County with nearby schools including Chattahoochee Elementary School, Coleman Middle School, and Duluth High School.
Ownership History
Date
Name
Owned For
Owner Type
Purchase Details
Closed on
Sep 23, 2017
Sold by
Myers Joseph M
Bought by
Myers Cheryl A
Current Estimated Value
Home Financials for this Owner
Home Financials are based on the most recent Mortgage that was taken out on this home.
Original Mortgage
$103,000
Outstanding Balance
$85,642
Interest Rate
3.83%
Mortgage Type
New Conventional
Estimated Equity
$403,205
Purchase Details
Closed on
Aug 2, 2005
Sold by
Myers Joseph M
Bought by
Myers Joseph M and Myers Cheryl
Home Financials for this Owner
Home Financials are based on the most recent Mortgage that was taken out on this home.
Original Mortgage
$136,165
Interest Rate
5.57%
Mortgage Type
VA
Purchase Details
Closed on
May 2, 1997
Sold by
Castle Homes Inc
Bought by
Myers Joseph M
Home Financials for this Owner
Home Financials are based on the most recent Mortgage that was taken out on this home.
Original Mortgage
$133,609
Interest Rate
7.98%
Mortgage Type
VA
Create a Home Valuation Report for This Property
The Home Valuation Report is an in-depth analysis detailing your home's value as well as a comparison with similar homes in the area
Home Values in the Area
Average Home Value in this Area
Purchase History
| Date | Buyer | Sale Price | Title Company |
|---|---|---|---|
| Myers Cheryl A | -- | -- | |
| Myers Joseph M | -- | -- | |
| Myers Joseph M | $131,000 | -- |
Source: Public Records
Mortgage History
| Date | Status | Borrower | Loan Amount |
|---|---|---|---|
| Open | Myers Cheryl A | $103,000 | |
| Previous Owner | Myers Joseph M | $136,165 | |
| Previous Owner | Myers Joseph M | $133,609 |
Source: Public Records
Tax History
| Year | Tax Paid | Tax Assessment Tax Assessment Total Assessment is a certain percentage of the fair market value that is determined by local assessors to be the total taxable value of land and additions on the property. | Land | Improvement |
|---|---|---|---|---|
| 2025 | $1,287 | $200,600 | $29,920 | $170,680 |
| 2024 | $4,181 | $186,680 | $32,400 | $154,280 |
| 2023 | $4,181 | $202,720 | $32,400 | $170,320 |
| 2022 | $3,828 | $168,720 | $26,000 | $142,720 |
| 2021 | $3,042 | $126,440 | $20,000 | $106,440 |
| 2020 | $3,073 | $126,440 | $20,000 | $106,440 |
| 2019 | $3,746 | $119,280 | $16,000 | $103,280 |
| 2018 | $2,674 | $107,360 | $16,000 | $91,360 |
| 2016 | $2,396 | $94,280 | $16,000 | $78,280 |
| 2015 | $3,004 | $94,280 | $16,000 | $78,280 |
| 2014 | $2,061 | $77,640 | $12,400 | $65,240 |
Source: Public Records
Map
Nearby Homes
- 3590 North St
- 3592 North St
- 3186 Moor View Rd
- 3106 Moor View Rd
- 2731 Pine Cone Ln
- 3791 Old Bridge Way
- 3757 Rogers Cove
- 2824 Carriage Rowe
- 3711 Thornbrooke Ct
- 3507 Ashby Pond Ln
- 2988 First St
- 3325 River Summit Trail
- 2825 Pine St
- 3875 Stonebriar Ct
- 3132 Hill St NW Unit 1
- 2711 Old Coach Rd
- 2915 Pine St
- 3614 Clearbrooke Way
- 3295 Hall Cir NW Unit 2
- 3295 Hall Cir NW Unit 3
- 2805 Nesbitt Crossing Way
- 3578 Nesbitt Crossing Cir Unit 1
- 3568 Nesbitt Crossing Cir Unit 1
- 3558 Nesbitt Crossing Cir Unit 1
- 2800 Nesbitt Crossing Way
- 3588 Nesbitt Crossing Cir Unit 1
- 3582 North St
- 2780 Nesbitt Crossing Way Unit 1
- 2790 Nesbitt Crossing Way Unit 1
- 2770 Nesbitt Crossing Way
- 3572 North St
- 3583 Nesbitt Crossing Cir Unit 1
- 2760 Nesbitt Crossing Way
- 3573 Nesbitt Crossing Cir Unit 1
- 3563 Nesbitt Crossing Cir
- 2745 Nesbitt Crossing Way Unit 1
- 3552 North St
- 2750 Nesbitt Crossing Way
- 2750 Nesbitt Crossing
- 2735 Nesbitt Crossing Way
Your Personal Tour Guide
Ask me questions while you tour the home.