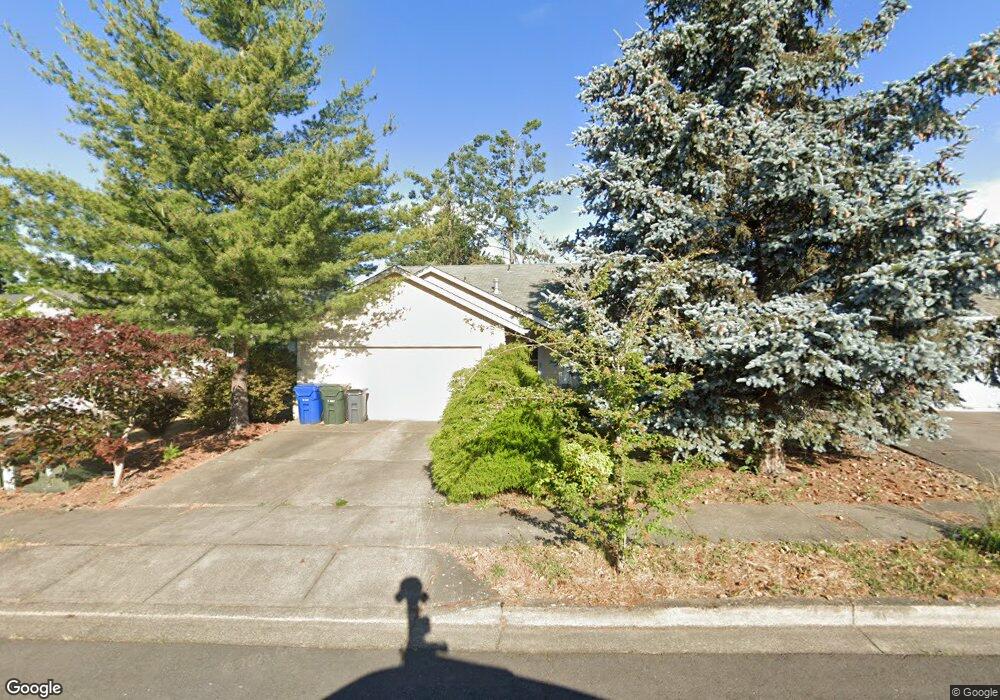
2795 Van Kleeck Place NW Salem, OR 97304
West Salem NeighborhoodEstimated Value: $370,379 - $421,000
3
Beds
2
Baths
1,190
Sq Ft
$329/Sq Ft
Est. Value
About This Home
This home is located at 2795 Van Kleeck Place NW, Salem, OR 97304 and is currently estimated at $391,595, approximately $329 per square foot. 2795 Van Kleeck Place NW is a home located in Polk County with nearby schools including Brush College Elementary School, Straub Middle School, and West Salem High School.
Ownership History
Date
Name
Owned For
Owner Type
Purchase Details
Closed on
Feb 25, 2025
Sold by
Muldoon R Michael
Bought by
Muldoon Family Trust and Muldoon
Current Estimated Value
Purchase Details
Closed on
Aug 12, 2009
Sold by
Shipley Robert and Shipley Kathleen
Bought by
Muldoon Sean F and Michael Muldoon R
Home Financials for this Owner
Home Financials are based on the most recent Mortgage that was taken out on this home.
Original Mortgage
$120,000
Interest Rate
5.3%
Mortgage Type
Purchase Money Mortgage
Purchase Details
Closed on
Jun 30, 2004
Sold by
Dunsmore Jon R and Dunsmore Erica L
Bought by
Shipley Robert and Shipley Kathleen
Home Financials for this Owner
Home Financials are based on the most recent Mortgage that was taken out on this home.
Original Mortgage
$113,500
Interest Rate
6.31%
Mortgage Type
Purchase Money Mortgage
Create a Home Valuation Report for This Property
The Home Valuation Report is an in-depth analysis detailing your home's value as well as a comparison with similar homes in the area
Home Values in the Area
Average Home Value in this Area
Purchase History
| Date | Buyer | Sale Price | Title Company |
|---|---|---|---|
| Muldoon Family Trust | -- | None Listed On Document | |
| Muldoon Sean F | $176,000 | Ticor Title | |
| Shipley Robert | $141,900 | First American Title |
Source: Public Records
Mortgage History
| Date | Status | Borrower | Loan Amount |
|---|---|---|---|
| Previous Owner | Muldoon Sean F | $120,000 | |
| Previous Owner | Shipley Robert | $113,500 |
Source: Public Records
Tax History Compared to Growth
Tax History
| Year | Tax Paid | Tax Assessment Tax Assessment Total Assessment is a certain percentage of the fair market value that is determined by local assessors to be the total taxable value of land and additions on the property. | Land | Improvement |
|---|---|---|---|---|
| 2025 | $3,273 | $178,910 | $48,230 | $130,680 |
| 2024 | $3,273 | $173,700 | $46,820 | $126,880 |
| 2023 | $3,179 | $168,650 | $45,460 | $123,190 |
| 2022 | $3,077 | $163,740 | $44,130 | $119,610 |
| 2021 | $2,989 | $158,980 | $42,850 | $116,130 |
| 2020 | $2,900 | $154,350 | $41,600 | $112,750 |
| 2019 | $2,799 | $149,860 | $40,380 | $109,480 |
| 2018 | $2,753 | $145,500 | $39,210 | $106,290 |
| 2017 | $2,481 | $141,270 | $38,070 | $103,200 |
| 2016 | $2,422 | $137,160 | $36,960 | $100,200 |
| 2015 | $2,442 | $133,170 | $35,890 | $97,280 |
| 2014 | $2,334 | $129,300 | $34,840 | $94,460 |
Source: Public Records
Map
Nearby Homes
- 2775 Wallace Hills Ct NW
- 0 Wallace Rd NW Unit 468567809
- 2858 Oakcrest Dr NW Unit 9
- 2959 Vick Ave NW
- 2930 Eric Ct NW
- 3074 Oakcrest Dr NW
- 3012 Winslow Way NW Unit 3012
- 2438 Whetstone Ct NW
- 3043 Winslow Way NW
- 2165 Teakwood Ave NW
- 0 Morrow Ct NW Unit 715467966
- 2388 Westminster Ave NW
- 2263 Banyonwood Ave NW
- 1882 Woodstock Cir NW
- 2367 Wilark Dr NW
- 1602 Sunrise Cir NW
- 1835 Wakefield Ct NW
- 1624 Sunrise Cir NW
- 2719 Cherry Hill Ct NW
- 2230 Emmett Dr NW
- 2807 Van Kleeck Place NW
- 1727 Van Kleeck Ct NW
- 2785 Van Kleeck Place NW
- 2800 Van Kleeck Place NW
- 2700 Van Kleeck Place NW
- Lot 33 Van Kleeck Place NW
- - Van Kleeck Place NW
- 2817 Van Kleeck Place NW
- 2775 Van Kleeck Place NW
- 2780 Wallace Hills Ct NW
- 2800 van Kleeck (Block Of) Place
- 2827 Van Kleeck Place NW
- 2802 Van Kleeck Place NW
- 2812 Van Kleeck Place NW
- 2792 Van Kleeck Place NW
- 2770 Wallace Hills Ct NW
- - van Kleeck (Lot 33)
- 2782 Van Kleeck Place NW
- 2847 Van Kleeck Place NW
- 2837 Van Kleeck Place NW