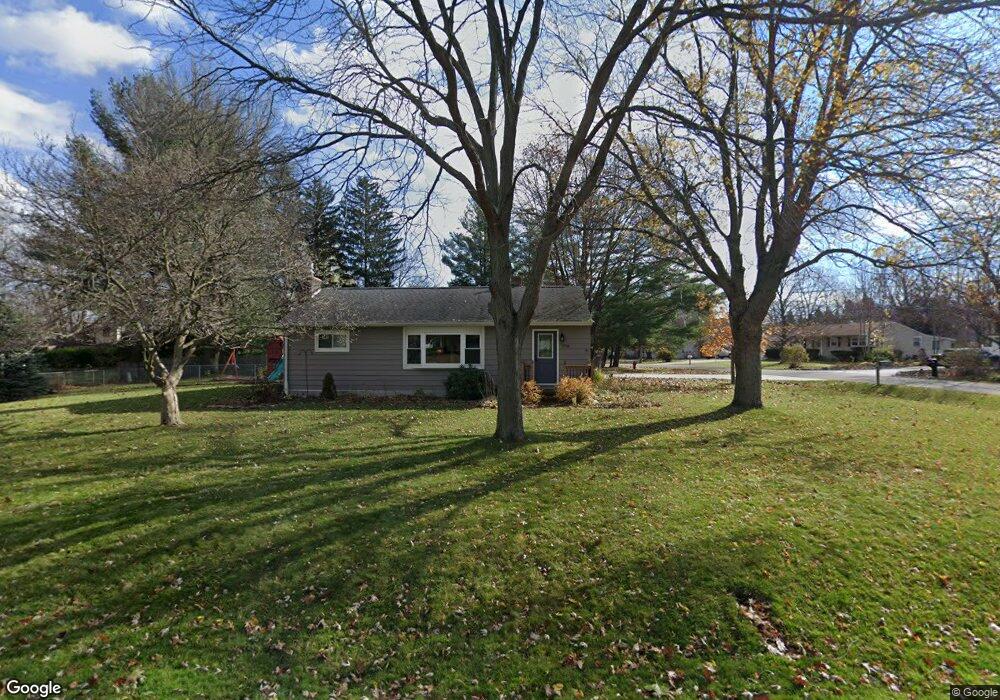
2796 Memory Ln Lansing, MI 48911
Estimated Value: $213,735 - $272,000
3
Beds
2
Baths
1,201
Sq Ft
$206/Sq Ft
Est. Value
About This Home
This home is located at 2796 Memory Ln, Lansing, MI 48911 and is currently estimated at $247,934, approximately $206 per square foot. 2796 Memory Ln is a home located in Ingham County with nearby schools including Elliott Elementary School, Hope Middle School, and Holt Junior High School.
Ownership History
Date
Name
Owned For
Owner Type
Purchase Details
Closed on
Apr 13, 2021
Sold by
Wyman Jeffrey E and Wyman Melanie
Bought by
Wyman Jeffrey E and Wyman Melanie J
Current Estimated Value
Purchase Details
Closed on
Aug 13, 2010
Sold by
Wyman Jeffrey E
Bought by
Wyman Jeffrey E and Wyman Melanie
Home Financials for this Owner
Home Financials are based on the most recent Mortgage that was taken out on this home.
Original Mortgage
$96,000
Outstanding Balance
$32,289
Interest Rate
4.6%
Mortgage Type
New Conventional
Estimated Equity
$215,645
Purchase Details
Closed on
Sep 11, 2002
Sold by
Granger James J and Granger Laura A
Bought by
Wyman Jeffrey E
Home Financials for this Owner
Home Financials are based on the most recent Mortgage that was taken out on this home.
Original Mortgage
$111,150
Interest Rate
6.18%
Mortgage Type
Purchase Money Mortgage
Purchase Details
Closed on
Feb 28, 1994
Create a Home Valuation Report for This Property
The Home Valuation Report is an in-depth analysis detailing your home's value as well as a comparison with similar homes in the area
Home Values in the Area
Average Home Value in this Area
Purchase History
| Date | Buyer | Sale Price | Title Company |
|---|---|---|---|
| Wyman Jeffrey E | -- | None Available | |
| Wyman Jeffrey E | -- | None Available | |
| Wyman Jeffrey E | $117,000 | Midstate Title Company | |
| -- | $73,000 | -- |
Source: Public Records
Mortgage History
| Date | Status | Borrower | Loan Amount |
|---|---|---|---|
| Open | Wyman Jeffrey E | $96,000 | |
| Previous Owner | Wyman Jeffrey E | $111,150 |
Source: Public Records
Tax History
| Year | Tax Paid | Tax Assessment Tax Assessment Total Assessment is a certain percentage of the fair market value that is determined by local assessors to be the total taxable value of land and additions on the property. | Land | Improvement |
|---|---|---|---|---|
| 2025 | $3,267 | $101,200 | $30,000 | $71,200 |
| 2024 | $8 | $98,700 | $27,000 | $71,700 |
| 2023 | $3,045 | $89,300 | $24,400 | $64,900 |
| 2022 | $2,900 | $81,700 | $21,400 | $60,300 |
| 2021 | $2,899 | $80,600 | $15,000 | $65,600 |
| 2020 | $2,923 | $73,400 | $15,000 | $58,400 |
| 2019 | $2,800 | $69,800 | $15,000 | $54,800 |
| 2018 | $2,784 | $65,600 | $15,000 | $50,600 |
| 2017 | $2,544 | $65,600 | $15,000 | $50,600 |
| 2016 | $2,651 | $64,700 | $15,200 | $49,500 |
| 2015 | $1,979 | $59,800 | $30,454 | $29,346 |
| 2014 | $1,979 | $40,100 | $20,835 | $19,265 |
Source: Public Records
Map
Nearby Homes
- 2816 Memory Ln
- 2611 Navigator
- 4029 N Pine Dell Dr
- 4094 Sebring Dr
- 4106 Sebring Dr
- 4118 Sebring Dr
- 2650 Navigator Ln
- 2655 Navigator Ln
- 2712 Galiot Ct
- 2645 Navigator Ln
- 2635 Navigator Ln
- 2617 Navigator Ln
- 2668 Maritime Dr
- 2616 Navigator
- 2745 Maritime Dr
- 0 Dell Rd Unit 290382
- 2612 Navigator Ln
- 3990 Camperdown Dr
- 3900 Bayberry Ln
- 3980 Applegrove Ln
- 4022 S Pine Dell Dr
- 2808 Memory Ln
- 4044 S Pine Dell Dr
- 4029 S Pine Dell Dr
- 4037 Pine Dell Dr S
- 4021 S Pine Dell Dr
- 4037 S Pine Dell Dr
- 2787 Pinetree Rd
- 4010 S Pine Dell Dr
- 2807 Memory Ln
- 2797 Pine Tree Rd
- 2797 Pinetree Rd
- 2797 Pine
- 2819 Memory Ln
- 4011 S Pine Dell Dr
- 4045 S Pine Dell Dr
- 4054 S Pine Dell Dr
- 2821 Pinetree Rd
- 2826 Memory Ln
- 2775 Pinetree Rd
Your Personal Tour Guide
Ask me questions while you tour the home.