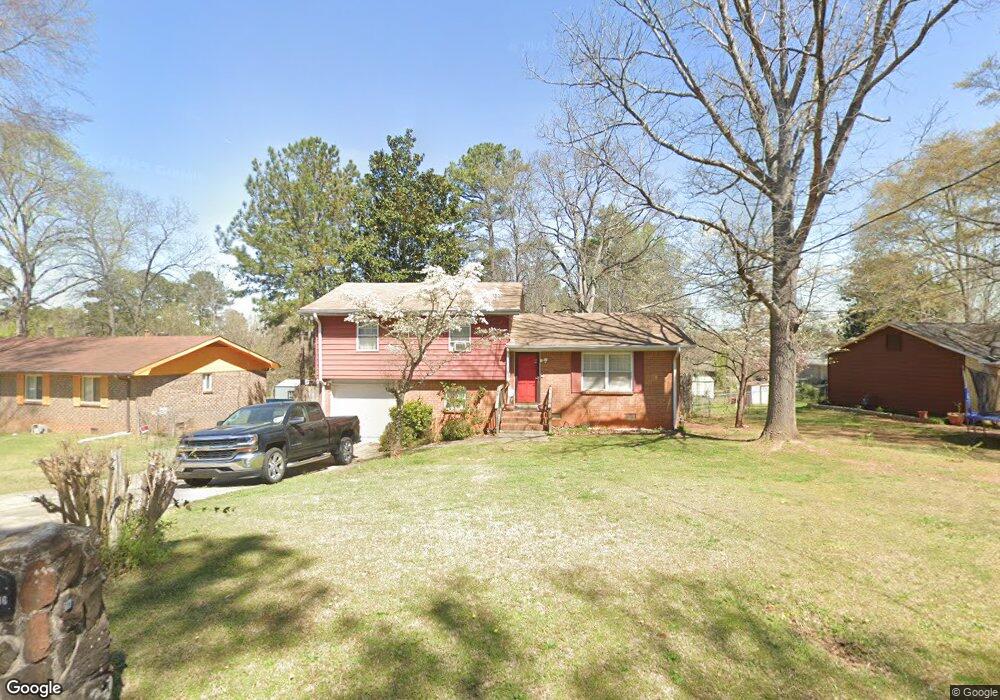
2796 Peggy Sue Ln Unit 1 Morrow, GA 30260
Estimated Value: $172,575 - $235,000
3
Beds
2
Baths
1,175
Sq Ft
$172/Sq Ft
Est. Value
About This Home
This home is located at 2796 Peggy Sue Ln Unit 1, Morrow, GA 30260 and is currently estimated at $202,144, approximately $172 per square foot. 2796 Peggy Sue Ln Unit 1 is a home located in Clayton County with nearby schools including Mt. Zion Primary School, Mount Zion Elementary School, and Rex Mill Middle School.
Ownership History
Date
Name
Owned For
Owner Type
Purchase Details
Closed on
Feb 16, 2002
Sold by
Moorer Patrice
Bought by
Moorer Patrice and Moorer Jermaine
Current Estimated Value
Home Financials for this Owner
Home Financials are based on the most recent Mortgage that was taken out on this home.
Original Mortgage
$74,501
Interest Rate
6.8%
Mortgage Type
FHA
Purchase Details
Closed on
Apr 14, 1999
Sold by
Montgomery Kathleen A
Bought by
Robinson Lenon and Robinson Carol J
Home Financials for this Owner
Home Financials are based on the most recent Mortgage that was taken out on this home.
Original Mortgage
$77,460
Interest Rate
6.98%
Mortgage Type
FHA
Purchase Details
Closed on
Jan 15, 1999
Sold by
Montgomery Todd D
Bought by
Montgomery Kathleen A
Purchase Details
Closed on
Apr 17, 1996
Sold by
Hutson Rita D
Bought by
Montgomery Todd D Kathleen
Purchase Details
Closed on
Mar 21, 1996
Sold by
Essex Donald T
Bought by
Hutson Rita D
Create a Home Valuation Report for This Property
The Home Valuation Report is an in-depth analysis detailing your home's value as well as a comparison with similar homes in the area
Home Values in the Area
Average Home Value in this Area
Purchase History
| Date | Buyer | Sale Price | Title Company |
|---|---|---|---|
| Moorer Patrice | -- | -- | |
| Robinson Lenon | $77,500 | -- | |
| Montgomery Kathleen A | -- | -- | |
| Montgomery Todd D Kathleen | $72,900 | -- | |
| Hutson Rita D | $43,400 | -- |
Source: Public Records
Mortgage History
| Date | Status | Borrower | Loan Amount |
|---|---|---|---|
| Previous Owner | Moorer Patrice | $74,501 | |
| Previous Owner | Robinson Lenon | $77,460 | |
| Closed | Montgomery Todd D Kathleen | $0 |
Source: Public Records
Tax History Compared to Growth
Tax History
| Year | Tax Paid | Tax Assessment Tax Assessment Total Assessment is a certain percentage of the fair market value that is determined by local assessors to be the total taxable value of land and additions on the property. | Land | Improvement |
|---|---|---|---|---|
| 2024 | $989 | $63,120 | $7,200 | $55,920 |
| 2023 | $2,084 | $57,720 | $7,200 | $50,520 |
| 2022 | $681 | $47,560 | $7,200 | $40,360 |
| 2021 | $526 | $39,160 | $7,200 | $31,960 |
| 2020 | $465 | $35,515 | $7,200 | $28,315 |
| 2019 | $908 | $31,513 | $6,400 | $25,113 |
| 2018 | $738 | $27,308 | $6,400 | $20,908 |
| 2017 | $640 | $24,876 | $6,400 | $18,476 |
| 2016 | $557 | $22,837 | $6,400 | $16,437 |
| 2015 | $359 | $0 | $0 | $0 |
| 2014 | $473 | $20,999 | $6,400 | $14,599 |
Source: Public Records
Map
Nearby Homes
- 2877 Kensington Way
- 2959 Drexel Ln
- 6852 Silver Maple Dr
- 6848 Silver Maple Dr
- 6844 Silver Maple Dr
- 2968 Preston Dr
- 6968 Fielder Rd
- 2973 Botany Dr
- 6921 Babbling Brook Dr
- 3087 Drexel Ln
- 2705 Heritage Ln
- 7074 Babbling Brook Dr
- 7161 Laurel Creek Dr
- 2681 Heritage Ln
- 2688 Heritage Ln
- 3145 Deerfield Way
- 3140 Glen Hollow Dr
- 7101 Hazelwood Dr Unit 8
- 2810 Peggy Sue Ln Unit N/a
- 2810 Peggy Sue Ln
- 2788 Peggy Sue Ln Unit 1
- 2811 Peggy Sue Ln
- 7044 Peggy Sue Ln
- 2803 Peggy Sue Ln
- 2810 Peggy Sue Ln
- 2781 Chalet Ct
- 7039 Stephens Dr
- 2780 Peggy Sue Ln Unit 1
- 2785 Chalet Ct
- 2785 Peggy Sue Ln
- 7031 Stephens Dr
- 2777 Chalet Ct
- 2770 Peggy Sue Ln
- 7023 Stephens Dr
- 2819 Peggy Sue Ln
- 2777 Peggy Sue Ln Unit 1
- 7030 Silver Maple Dr
- 2788 Chalet Ct