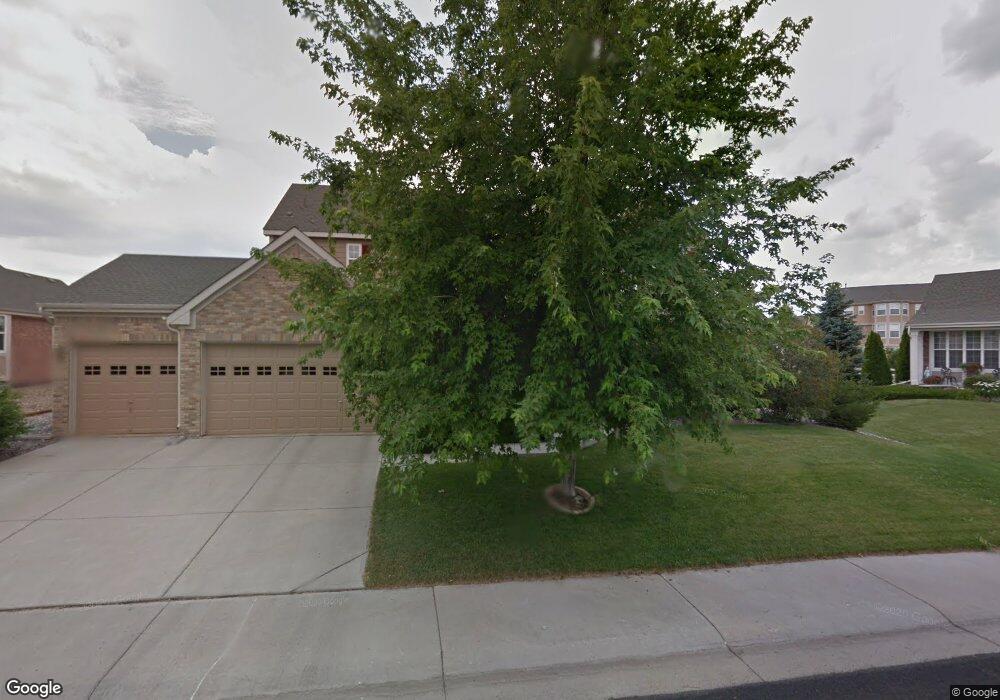
2796 W 111th Loop Denver, CO 80234
Estimated Value: $833,000 - $1,068,000
6
Beds
5
Baths
4,732
Sq Ft
$206/Sq Ft
Est. Value
About This Home
This home is located at 2796 W 111th Loop, Denver, CO 80234 and is currently estimated at $975,809, approximately $206 per square foot. 2796 W 111th Loop is a home located in Adams County with nearby schools including Westview Elementary School, Silver Hills Middle School, and Northglenn High School.
Ownership History
Date
Name
Owned For
Owner Type
Purchase Details
Closed on
May 13, 2024
Sold by
Fountain Jody A and Fountain Kevin N
Bought by
Pura Vida 7 Trust
Current Estimated Value
Purchase Details
Closed on
Nov 15, 2019
Sold by
Brown Faye Griffin
Bought by
Fountain Kevin N and Fountain Jody A
Home Financials for this Owner
Home Financials are based on the most recent Mortgage that was taken out on this home.
Original Mortgage
$526,500
Interest Rate
3.65%
Mortgage Type
New Conventional
Purchase Details
Closed on
Dec 1, 2011
Sold by
Brown Troy Lane and Brown Faye Griffin
Bought by
The Troy Lane Brown Revocable Trust
Purchase Details
Closed on
Nov 8, 2002
Sold by
Beazer Homes Holdings Corp
Bought by
Brown Troy Lane and Brown Faye Griffin
Home Financials for this Owner
Home Financials are based on the most recent Mortgage that was taken out on this home.
Original Mortgage
$68,000
Interest Rate
4.12%
Mortgage Type
Unknown
Create a Home Valuation Report for This Property
The Home Valuation Report is an in-depth analysis detailing your home's value as well as a comparison with similar homes in the area
Home Values in the Area
Average Home Value in this Area
Purchase History
| Date | Buyer | Sale Price | Title Company |
|---|---|---|---|
| Pura Vida 7 Trust | -- | None Listed On Document | |
| Fountain Kevin N | $585,000 | Wfg National Title | |
| The Troy Lane Brown Revocable Trust | -- | None Available | |
| Brown Troy Lane | $442,343 | Land Title |
Source: Public Records
Mortgage History
| Date | Status | Borrower | Loan Amount |
|---|---|---|---|
| Previous Owner | Fountain Kevin N | $526,500 | |
| Previous Owner | Brown Troy Lane | $68,000 |
Source: Public Records
Tax History
| Year | Tax Paid | Tax Assessment Tax Assessment Total Assessment is a certain percentage of the fair market value that is determined by local assessors to be the total taxable value of land and additions on the property. | Land | Improvement |
|---|---|---|---|---|
| 2025 | $6,282 | $66,640 | $10,610 | $56,030 |
| 2024 | $6,282 | $61,250 | $9,750 | $51,500 |
| 2023 | $6,214 | $67,510 | $10,550 | $56,960 |
| 2022 | $5,118 | $48,690 | $10,840 | $37,850 |
| 2021 | $5,285 | $48,690 | $10,840 | $37,850 |
| 2020 | $4,925 | $46,270 | $11,150 | $35,120 |
| 2019 | $4,935 | $46,270 | $11,150 | $35,120 |
| 2018 | $4,688 | $42,520 | $7,920 | $34,600 |
| 2017 | $4,230 | $42,520 | $7,920 | $34,600 |
| 2016 | $4,342 | $42,320 | $7,240 | $35,080 |
| 2015 | $4,336 | $42,320 | $7,240 | $35,080 |
| 2014 | $3,979 | $37,630 | $6,930 | $30,700 |
Source: Public Records
Map
Nearby Homes
- 2804 W 111th Loop
- 2556 W 110th Place
- 11105 Alcott St Unit A
- 3076 W 112th Ct Unit D
- 3043 W 109th Place
- 3240 W 114th Cir Unit D
- 3066 W 109th Place
- 3403 W 111th Dr
- 11433 Decatur Ct
- 2791 W 114th Ct
- 2302 Ranch Dr
- 11201 Wyandot St
- 10735 Eliot Cir Unit 201
- 3329 W 109th Ct
- 3401 W 111th Loop Unit B
- 2562 W 107th Place
- 3019 W 107th Place Unit D
- 10752 Zuni Dr
- 2114 Ranch Dr
- 2561 Ranch Reserve Ridge
- 2776 W 111th Loop
- 2812 W 111th Loop
- 2795 W 111th Loop
- 2756 W 111th Loop
- 11099 Decatur St
- 2775 W 111th Loop
- 2838 W 111th Loop
- 11098 Decatur St
- 2857 W 111th Ave
- 2755 W 111th Loop
- 2854 W 111th Loop
- 11089 Decatur St
- 2736 W 111th Loop
- 11088 Decatur St
- 2846 W 111th Ave
- 2784 W 111th Loop
- 11097 Clay Dr
- 2735 W 111th Loop
- 2877 W 111th Ave
- 11079 Decatur St
Your Personal Tour Guide
Ask me questions while you tour the home.