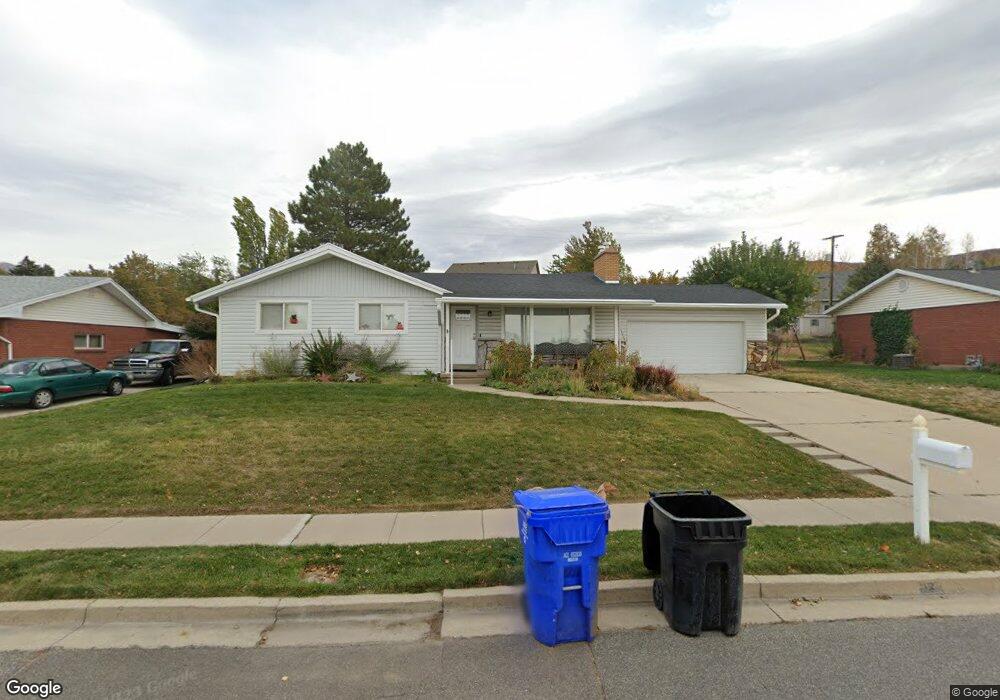
2797 S 450 W Bountiful, UT 84010
Estimated Value: $542,000 - $598,000
5
Beds
3
Baths
2,528
Sq Ft
$229/Sq Ft
Est. Value
About This Home
This home is located at 2797 S 450 W, Bountiful, UT 84010 and is currently estimated at $579,266, approximately $229 per square foot. 2797 S 450 W is a home located in Davis County with nearby schools including Boulton School, South Davis Junior High School, and Woods Cross High School.
Ownership History
Date
Name
Owned For
Owner Type
Purchase Details
Closed on
Jun 12, 2020
Sold by
Walter Jared A
Bought by
Walter Jared A and Walter Crystal L
Current Estimated Value
Home Financials for this Owner
Home Financials are based on the most recent Mortgage that was taken out on this home.
Original Mortgage
$340,000
Outstanding Balance
$300,717
Interest Rate
3.2%
Mortgage Type
New Conventional
Estimated Equity
$278,549
Purchase Details
Closed on
Jun 11, 2020
Sold by
Clayton Bridger and Walker Tori
Bought by
Walter Jared A
Home Financials for this Owner
Home Financials are based on the most recent Mortgage that was taken out on this home.
Original Mortgage
$340,000
Outstanding Balance
$300,717
Interest Rate
3.2%
Mortgage Type
New Conventional
Estimated Equity
$278,549
Purchase Details
Closed on
Sep 19, 2016
Sold by
Parham Jennie
Bought by
Clayton Bridger and Walker Tori
Purchase Details
Closed on
Jul 28, 1999
Sold by
Freeman Carl L and Freeman Linda J
Bought by
Freeman Carl L and Freeman Linda J
Create a Home Valuation Report for This Property
The Home Valuation Report is an in-depth analysis detailing your home's value as well as a comparison with similar homes in the area
Purchase History
| Date | Buyer | Sale Price | Title Company |
|---|---|---|---|
| Walter Jared A | -- | Pinnacle Title Insurance A | |
| Walter Jared A | -- | North American Tit | |
| Clayton Bridger | -- | None Available | |
| Freeman Carl L | -- | -- |
Source: Public Records
Mortgage History
| Date | Status | Borrower | Loan Amount |
|---|---|---|---|
| Open | Walter Jared A | $340,000 |
Source: Public Records
Tax History
| Year | Tax Paid | Tax Assessment Tax Assessment Total Assessment is a certain percentage of the fair market value that is determined by local assessors to be the total taxable value of land and additions on the property. | Land | Improvement |
|---|---|---|---|---|
| 2025 | $3,247 | $298,100 | $140,770 | $157,330 |
| 2024 | $3,083 | $287,650 | $128,402 | $159,248 |
| 2023 | $2,972 | $500,000 | $233,811 | $266,189 |
| 2022 | $3,101 | $292,600 | $127,027 | $165,573 |
| 2021 | $2,848 | $412,000 | $166,347 | $245,653 |
| 2020 | $2,352 | $340,000 | $141,105 | $198,895 |
| 2019 | $2,219 | $316,000 | $142,442 | $173,558 |
| 2018 | $2,055 | $288,000 | $139,480 | $148,520 |
| 2016 | $1,514 | $121,000 | $46,939 | $74,061 |
| 2015 | $1,570 | $118,690 | $46,939 | $71,751 |
| 2014 | $115 | $118,843 | $46,939 | $71,904 |
| 2013 | -- | $114,656 | $43,945 | $70,711 |
Source: Public Records
Map
Nearby Homes
- 2749 S 450 W
- 337 W 2900 S
- 404 W 2700 S
- 552 W 2900 S
- 544 W 2900 S
- 554 W 2900 S
- 527 Applewood Dr
- 468 W 3200 S
- 3279 Plum Tree Ln
- 558 Eastpointe Cir
- 304 W 2300 S
- 336 W 3500 S
- 678 W 3200 S
- 3285 S Davis Blvd
- 19 E North Canyon Rd
- 746 W 3200 S
- 69 E North Canyon Rd
- 652 W 3600 S
- 2095 S Main St Unit 13
- 683 Merlin St Unit 4630
Your Personal Tour Guide
Ask me questions while you tour the home.