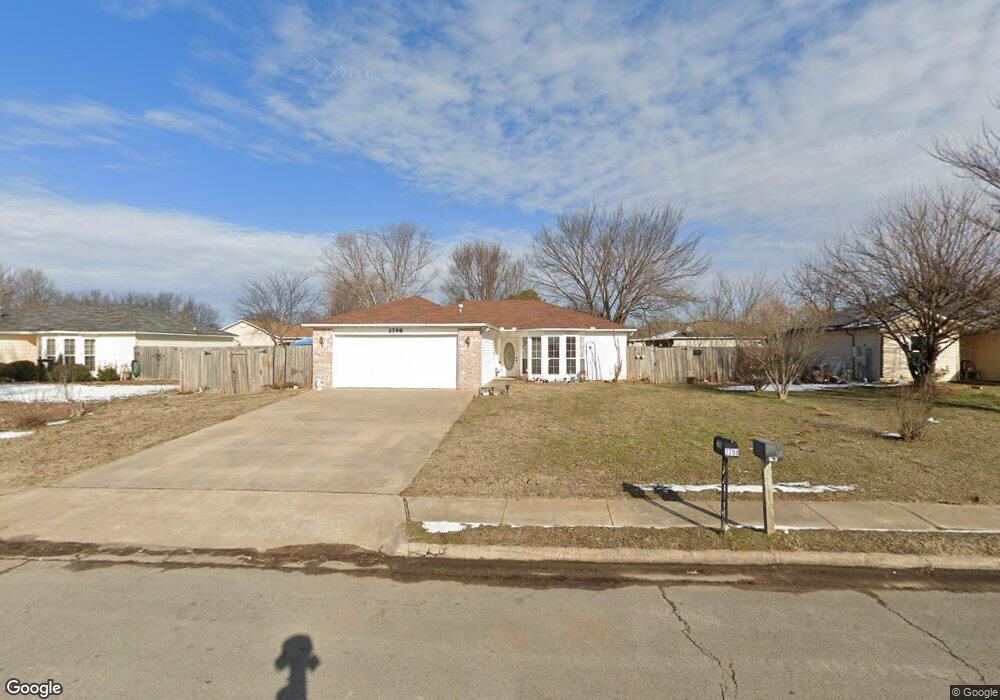
2798 Kenton St Springdale, AR 72764
Estimated Value: $241,000 - $255,000
3
Beds
2
Baths
1,228
Sq Ft
$200/Sq Ft
Est. Value
About This Home
This home is located at 2798 Kenton St, Springdale, AR 72764 and is currently estimated at $245,405, approximately $199 per square foot. 2798 Kenton St is a home located in Washington County with nearby schools including Harp Elementary School, J. O. Kelly Middle School, and George Junior High School.
Ownership History
Date
Name
Owned For
Owner Type
Purchase Details
Closed on
Apr 14, 2010
Sold by
Nava Eduardo
Bought by
Shannon Phyllis R
Current Estimated Value
Purchase Details
Closed on
Jun 12, 2006
Sold by
Navarro Omar
Bought by
Nava Eduardo
Home Financials for this Owner
Home Financials are based on the most recent Mortgage that was taken out on this home.
Original Mortgage
$127,500
Interest Rate
8.55%
Mortgage Type
Fannie Mae Freddie Mac
Purchase Details
Closed on
Dec 14, 2004
Sold by
Villalobos Hilda Aurora and Villalobos Pedro
Bought by
Navarro Omar
Home Financials for this Owner
Home Financials are based on the most recent Mortgage that was taken out on this home.
Original Mortgage
$110,200
Interest Rate
5.7%
Mortgage Type
Purchase Money Mortgage
Purchase Details
Closed on
Nov 21, 1997
Bought by
Berry Branch Investments, Llc
Create a Home Valuation Report for This Property
The Home Valuation Report is an in-depth analysis detailing your home's value as well as a comparison with similar homes in the area
Home Values in the Area
Average Home Value in this Area
Purchase History
| Date | Buyer | Sale Price | Title Company |
|---|---|---|---|
| Shannon Phyllis R | $76,000 | None Available | |
| Nava Eduardo | $128,000 | Heritage Land Title Of Ar | |
| Navarro Omar | -- | Heritage Land Title Of Ar | |
| Navarro Omar | $107,000 | -- | |
| Berry Branch Investments, Llc | -- | -- |
Source: Public Records
Mortgage History
| Date | Status | Borrower | Loan Amount |
|---|---|---|---|
| Previous Owner | Nava Eduardo | $127,500 | |
| Previous Owner | Navarro Omar | $110,200 |
Source: Public Records
Tax History Compared to Growth
Tax History
| Year | Tax Paid | Tax Assessment Tax Assessment Total Assessment is a certain percentage of the fair market value that is determined by local assessors to be the total taxable value of land and additions on the property. | Land | Improvement |
|---|---|---|---|---|
| 2025 | $251 | $41,140 | $14,000 | $27,140 |
| 2024 | $351 | $41,140 | $14,000 | $27,140 |
| 2023 | $442 | $41,140 | $14,000 | $27,140 |
| 2022 | $492 | $25,140 | $5,000 | $20,140 |
| 2021 | $492 | $25,140 | $5,000 | $20,140 |
| 2020 | $492 | $25,140 | $5,000 | $20,140 |
| 2019 | $492 | $16,460 | $4,370 | $12,090 |
| 2018 | $517 | $16,460 | $4,370 | $12,090 |
| 2017 | $509 | $16,460 | $4,370 | $12,090 |
| 2016 | $509 | $16,460 | $4,370 | $12,090 |
| 2015 | $509 | $16,460 | $4,370 | $12,090 |
| 2014 | $539 | $17,030 | $4,370 | $12,660 |
Source: Public Records
Map
Nearby Homes
- 2523 Meadow Lake St
- 2544 Butterfield Coach Rd
- 4535 Leafield St
- 2541 Appleglen
- 2758 Suncrest Ave
- 2638 Suncrest Ave
- 3345 Clearwater Cove
- 3083 Rocky Branch Ave
- 2871 Orchard St
- 2616 Cassidy Ave
- 2703 Cassidy Ave
- 2947 Beaver Creek St
- 3205 Summer View Ave
- 2862 Wyandotte Ave
- 3011 Beaver Creek St
- 1779 Apple Butter St
- 3631 Tranquility St
- 3653 Tranquility St
- 3715 Julio Rd
- 2720 Granny Smith Ave
- 2786 Kenton St
- 2800 Kenton St
- 2694 Victoria St
- 2797 Wembley Place
- 2785 Wembley Place
- 2770 Kenton St
- 2799 Kenton St
- 2801 Kenton St
- 2670 Victoria St
- 2787 Kenton St
- 2769 Wembley Place
- 2817 Kenton St
- 2771 Kenton St
- 2709 Victoria St
- 2727 Victoria St
- 2648 Victoria St
- 2745 Victoria St
- 2685 Victoria St
- 2796 Wembley Place
- 2663 Victoria St