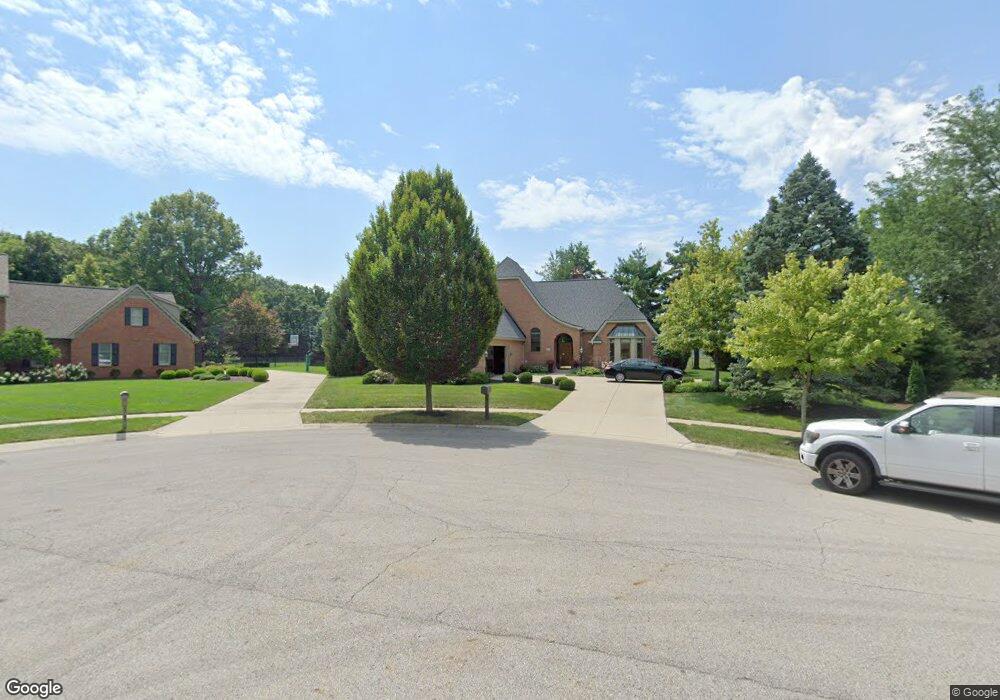
2799 Annabelle Ct Grove City, OH 43123
Estimated Value: $460,000 - $600,000
3
Beds
4
Baths
2,968
Sq Ft
$181/Sq Ft
Est. Value
About This Home
This home is located at 2799 Annabelle Ct, Grove City, OH 43123 and is currently estimated at $535,833, approximately $180 per square foot. 2799 Annabelle Ct is a home located in Franklin County with nearby schools including Hayes Intermediate School, Jc Sommer Elementary School, and Jackson Middle School.
Ownership History
Date
Name
Owned For
Owner Type
Purchase Details
Closed on
Apr 2, 2020
Sold by
Hunt Jennifer D
Bought by
Snashall Thomas A and Snashall Nancy A
Current Estimated Value
Purchase Details
Closed on
Mar 23, 2018
Bought by
Snashall Nancy A Tr & Snashall Thom
Purchase Details
Closed on
Jul 21, 2008
Sold by
Snashall Thomas A and Snashall Nancy A
Bought by
Snashall Nancy A and Snashall Thomas A
Purchase Details
Closed on
Jan 7, 1988
Bought by
Snashall Thomas A
Create a Home Valuation Report for This Property
The Home Valuation Report is an in-depth analysis detailing your home's value as well as a comparison with similar homes in the area
Home Values in the Area
Average Home Value in this Area
Purchase History
| Date | Buyer | Sale Price | Title Company |
|---|---|---|---|
| Snashall Thomas A | -- | None Available | |
| Snashall Nancy A Tr & Snashall Thom | -- | -- | |
| Snashall Nancy A | -- | Attorney | |
| Snashall Thomas A | $33,000 | -- |
Source: Public Records
Tax History Compared to Growth
Tax History
| Year | Tax Paid | Tax Assessment Tax Assessment Total Assessment is a certain percentage of the fair market value that is determined by local assessors to be the total taxable value of land and additions on the property. | Land | Improvement |
|---|---|---|---|---|
| 2024 | $8,734 | $201,850 | $36,750 | $165,100 |
| 2023 | $8,638 | $201,845 | $36,750 | $165,095 |
| 2022 | $8,395 | $146,410 | $18,900 | $127,510 |
| 2021 | $8,557 | $146,410 | $18,900 | $127,510 |
| 2020 | $8,529 | $146,410 | $18,900 | $127,510 |
| 2019 | $7,506 | $121,140 | $15,750 | $105,390 |
| 2018 | $7,787 | $121,140 | $15,750 | $105,390 |
| 2017 | $7,450 | $121,140 | $15,750 | $105,390 |
| 2016 | $8,093 | $120,410 | $19,780 | $100,630 |
| 2015 | $8,095 | $120,410 | $19,780 | $100,630 |
| 2014 | $8,101 | $120,410 | $19,780 | $100,630 |
| 2013 | $3,627 | $114,660 | $18,830 | $95,830 |
Source: Public Records
Map
Nearby Homes
- 2873 Woodgrove Dr
- 4370 Maplegrove Dr
- 4318 Maplegrove Dr
- 2690 Eugene Ave
- 4284 Beechgrove Dr
- 4277 Beechgrove Dr
- 4754 Glencross Ct
- 4236 Maplegrove Dr
- 2618 Vililly Cir W
- 4241 Ashgrove Dr
- 2651 Hoover Crossing Way
- 4287 Knapp Dr
- 2642 Gardenview Loop
- 2750 Longridge Way
- 2624 Gardenview Loop
- 2403 White Rd
- 3022 Crabapple Place Unit 4
- 4879 Blossom Way Unit 41
- 4881 Primrose Ct
- 4256 Eleanor Ave
- 2811 Annabelle Ct
- 2787 Annabelle Ct
- 2794 Annabelle Ct
- 2823 Annabelle Ct
- 2806 Annabelle Ct
- 2782 Annabelle Ct
- 2818 Annabelle Ct
- 2835 Annabelle Ct
- 2830 Annabelle Ct
- 2787 Buxton Ln
- 2797 Buxton Ln
- 2779 Buxton Ln
- 2807 Buxton Ln
- 2733 Clark Dr
- 2769 Buxton Ln
- 2847 Annabelle Ct
- 2737 Clark Dr
- 2817 Buxton Ln
- 2842 Annabelle Ct
- 2827 Buxton Ln