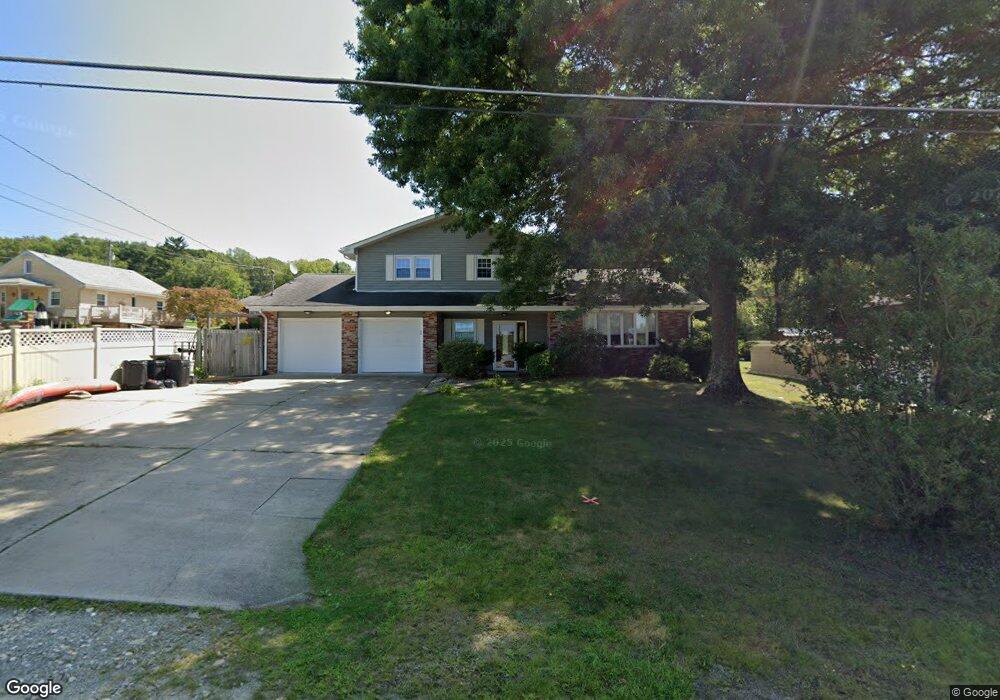
2799 Laurel Dr Export, PA 15632
Estimated Value: $108,768 - $298,000
3
Beds
3
Baths
--
Sq Ft
9,801
Sq Ft Lot
About This Home
This home is located at 2799 Laurel Dr, Export, PA 15632 and is currently estimated at $236,192. 2799 Laurel Dr is a home located in Westmoreland County with nearby schools including Franklin Regional Senior High School.
Ownership History
Date
Name
Owned For
Owner Type
Purchase Details
Closed on
Oct 3, 2011
Sold by
Susquehanna Home Finance Llc
Bought by
Neidigh Kenneth C and Neidigh Katie M
Current Estimated Value
Home Financials for this Owner
Home Financials are based on the most recent Mortgage that was taken out on this home.
Original Mortgage
$126,704
Outstanding Balance
$87,700
Interest Rate
4.87%
Mortgage Type
FHA
Estimated Equity
$148,492
Purchase Details
Closed on
May 12, 2004
Sold by
Larko William S and Larko Melinda J
Bought by
Robertson Robert E and Robertson Wendy L
Home Financials for this Owner
Home Financials are based on the most recent Mortgage that was taken out on this home.
Original Mortgage
$147,200
Interest Rate
5.75%
Mortgage Type
Unknown
Create a Home Valuation Report for This Property
The Home Valuation Report is an in-depth analysis detailing your home's value as well as a comparison with similar homes in the area
Home Values in the Area
Average Home Value in this Area
Purchase History
| Date | Buyer | Sale Price | Title Company |
|---|---|---|---|
| Neidigh Kenneth C | $130,000 | None Available | |
| Robertson Robert E | $155,000 | -- |
Source: Public Records
Mortgage History
| Date | Status | Borrower | Loan Amount |
|---|---|---|---|
| Open | Neidigh Kenneth C | $126,704 | |
| Previous Owner | Robertson Robert E | $147,200 |
Source: Public Records
Tax History
| Year | Tax Paid | Tax Assessment Tax Assessment Total Assessment is a certain percentage of the fair market value that is determined by local assessors to be the total taxable value of land and additions on the property. | Land | Improvement |
|---|---|---|---|---|
| 2026 | $3,703 | $23,680 | $3,020 | $20,660 |
| 2025 | $3,609 | $23,680 | $3,020 | $20,660 |
| 2024 | $3,526 | $23,680 | $3,020 | $20,660 |
| 2023 | $3,313 | $23,680 | $3,020 | $20,660 |
| 2022 | $3,248 | $23,680 | $3,020 | $20,660 |
| 2021 | $3,176 | $23,680 | $3,020 | $20,660 |
| 2020 | $3,116 | $23,680 | $3,020 | $20,660 |
| 2019 | $3,052 | $23,680 | $3,020 | $20,660 |
| 2018 | $2,999 | $23,680 | $3,020 | $20,660 |
| 2017 | $2,937 | $23,680 | $3,020 | $20,660 |
| 2016 | $2,878 | $23,680 | $3,020 | $20,660 |
| 2015 | $2,878 | $23,680 | $3,020 | $20,660 |
| 2014 | $2,859 | $23,680 | $3,020 | $20,660 |
Source: Public Records
Map
Nearby Homes
- 2122 Elizabeth Ct
- 3 Lou Anne Ln
- 4 Lou Ann Ln
- 508 Monticello Dr
- 7335 Ringertown Rd
- 26 W White Oak Dr
- Lot 8 Ringertown Rd
- Lot 7 Ringertown Rd
- Lot 5 Ringertown Rd
- Lot 6 Ringertown Rd
- Lot 9 Ringertown Rd
- Lot #4 Ann Marie Ct
- 123 Surrey Dr
- 100 Rose Ct S
- 37 Bel Aire Dr
- 703 Cherry Blossom Ct
- 156 Manor Rd
- W Pittsburgh St
- R3 Zoned Manor Road Southern Tract Parcel A-2
- 29 Freeport St
- 2787 Laurel Dr
- 6421 Old William Penn Hwy
- 6423 Old William Penn Hwy
- 2779 Laurel Dr
- 2800 Laurel Dr
- 2788 Laurel Dr
- 2775 Laurel Dr
- 6430 Old William Penn Hwy
- 6436 Old William Penn Hwy
- 6434 Old William Penn Hwy
- 6420 Old William Penn Hwy
- 3070 Magnolia St
- 6424 Old William Penn Hwy
- 6424 Old William Penn Hwy
- 2780 Laurel Dr
- 2765 Laurel Dr
- 3065 Magnolia St
- 3068 Magnolia St
- 2100 Elizabeth Ct
- 6438 Old William Penn Hwy
Your Personal Tour Guide
Ask me questions while you tour the home.