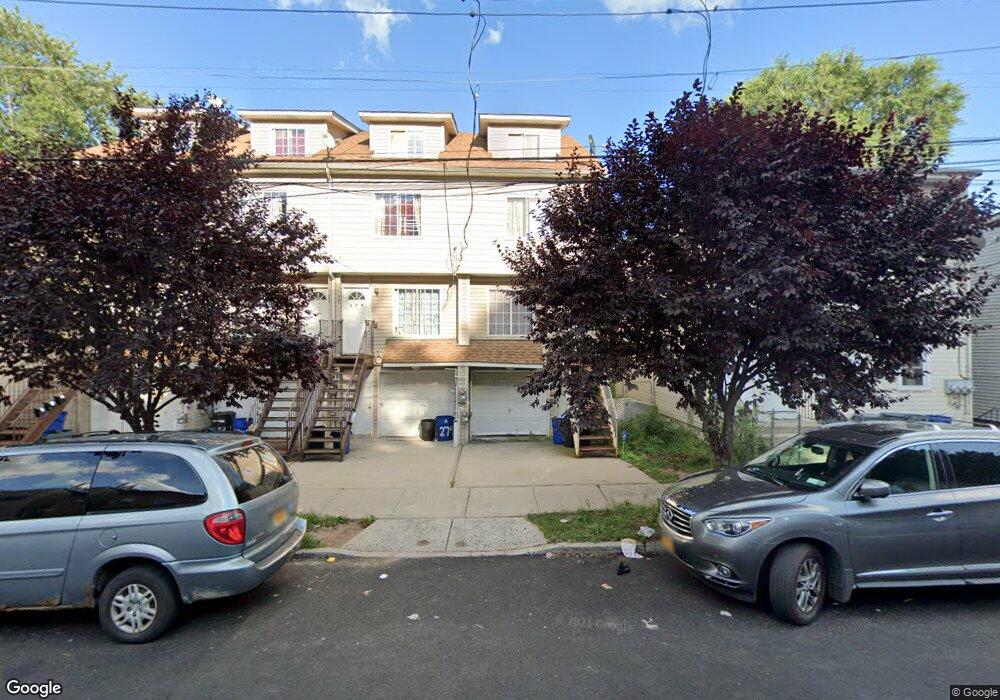
279A York Ave Staten Island, NY 10301
New Brighton NeighborhoodEstimated Value: $596,000 - $637,000
--
Bed
--
Bath
1,191
Sq Ft
$512/Sq Ft
Est. Value
About This Home
This home is located at 279A York Ave, Staten Island, NY 10301 and is currently estimated at $610,265, approximately $512 per square foot. 279A York Ave is a home located in Richmond County with nearby schools including P.S. 31 - William T. Davis, Is 61 William A Morris, and Curtis High School.
Ownership History
Date
Name
Owned For
Owner Type
Purchase Details
Closed on
Jul 3, 2012
Sold by
Gangaram Carlene
Bought by
Gene Plus Corp
Current Estimated Value
Purchase Details
Closed on
May 5, 2008
Sold by
Dg Of Si Inc
Bought by
Gangaram Carlene and Thomas John
Home Financials for this Owner
Home Financials are based on the most recent Mortgage that was taken out on this home.
Original Mortgage
$471,276
Interest Rate
5.93%
Mortgage Type
FHA
Create a Home Valuation Report for This Property
The Home Valuation Report is an in-depth analysis detailing your home's value as well as a comparison with similar homes in the area
Home Values in the Area
Average Home Value in this Area
Purchase History
| Date | Buyer | Sale Price | Title Company |
|---|---|---|---|
| Gene Plus Corp | $10,000 | The Judicial Title Insurance | |
| Gangaram Carlene | $475,000 | Old Republic National Title |
Source: Public Records
Mortgage History
| Date | Status | Borrower | Loan Amount |
|---|---|---|---|
| Previous Owner | Gangaram Carlene | $471,276 |
Source: Public Records
Tax History Compared to Growth
Tax History
| Year | Tax Paid | Tax Assessment Tax Assessment Total Assessment is a certain percentage of the fair market value that is determined by local assessors to be the total taxable value of land and additions on the property. | Land | Improvement |
|---|---|---|---|---|
| 2025 | $4,736 | $32,100 | $4,175 | $27,925 |
| 2024 | $4,736 | $27,780 | $4,788 | $22,992 |
| 2023 | $4,518 | $22,247 | $3,961 | $18,286 |
| 2022 | $4,190 | $30,480 | $5,640 | $24,840 |
| 2021 | $4,167 | $27,120 | $5,640 | $21,480 |
| 2020 | $5,243 | $23,400 | $5,640 | $17,760 |
| 2019 | $4,173 | $22,080 | $5,640 | $16,440 |
| 2018 | $3,779 | $18,539 | $5,202 | $13,337 |
| 2017 | $3,565 | $17,490 | $5,236 | $12,254 |
| 2016 | $3,299 | $16,500 | $5,640 | $10,860 |
| 2015 | $3,224 | $16,800 | $4,680 | $12,120 |
| 2014 | $3,224 | $16,800 | $4,680 | $12,120 |
Source: Public Records
Map
Nearby Homes