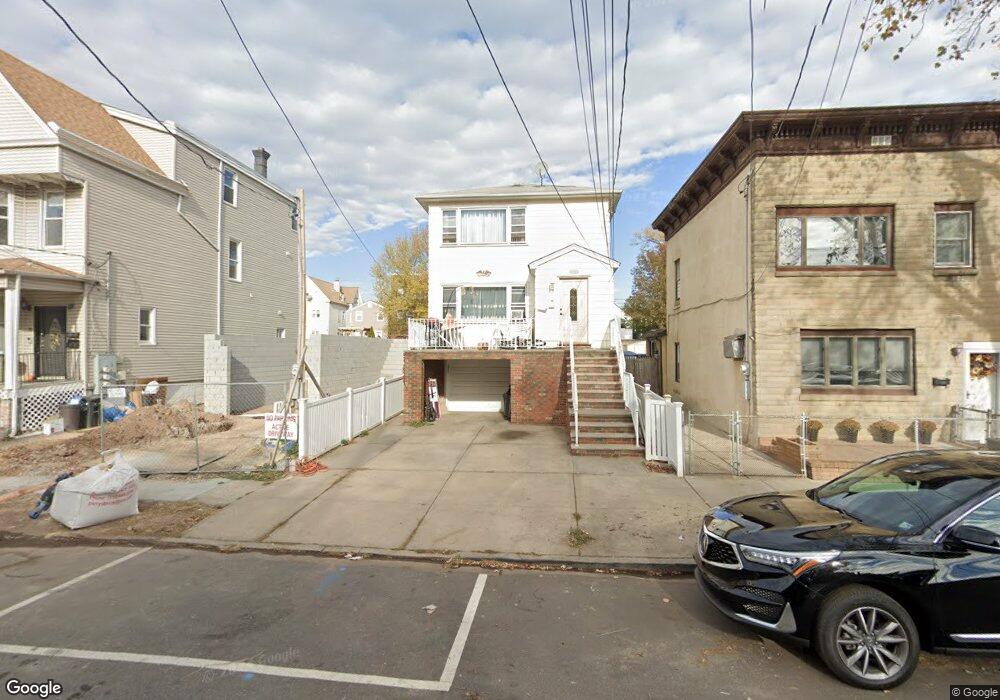
27A W 9th St Unit 2nd Floor Bayonne, NJ 07002
Constable Hook NeighborhoodEstimated Value: $648,000 - $935,000
2
Beds
1
Bath
2,142
Sq Ft
$349/Sq Ft
Est. Value
About This Home
This home is located at 27A W 9th St Unit 2nd Floor, Bayonne, NJ 07002 and is currently estimated at $746,657, approximately $348 per square foot. 27A W 9th St Unit 2nd Floor is a home located in Hudson County with nearby schools including Bayonne High School, All Saints Catholic Academy, and Beacon Christian Academy.
Ownership History
Date
Name
Owned For
Owner Type
Purchase Details
Closed on
May 29, 2014
Sold by
Girgis Shokry
Bought by
Girgis Shokry and Girgis Naglla M
Current Estimated Value
Purchase Details
Closed on
Feb 14, 2014
Sold by
Clark James H and Clark Kari
Bought by
Girgis Shokry
Home Financials for this Owner
Home Financials are based on the most recent Mortgage that was taken out on this home.
Original Mortgage
$171,000
Outstanding Balance
$130,017
Interest Rate
4.5%
Mortgage Type
Commercial
Estimated Equity
$616,640
Purchase Details
Closed on
Aug 18, 1997
Sold by
Haddad Bassam M
Bought by
Clark James H and Clark Kari
Home Financials for this Owner
Home Financials are based on the most recent Mortgage that was taken out on this home.
Original Mortgage
$147,600
Interest Rate
7.42%
Create a Home Valuation Report for This Property
The Home Valuation Report is an in-depth analysis detailing your home's value as well as a comparison with similar homes in the area
Home Values in the Area
Average Home Value in this Area
Purchase History
| Date | Buyer | Sale Price | Title Company |
|---|---|---|---|
| Girgis Shokry | -- | None Available | |
| Girgis Shokry | $285,000 | Agent For First Amer Title I | |
| Clark James H | $164,000 | Lawyers Title Insurance Corp |
Source: Public Records
Mortgage History
| Date | Status | Borrower | Loan Amount |
|---|---|---|---|
| Open | Girgis Shokry | $171,000 | |
| Previous Owner | Clark James H | $147,600 |
Source: Public Records
Tax History Compared to Growth
Tax History
| Year | Tax Paid | Tax Assessment Tax Assessment Total Assessment is a certain percentage of the fair market value that is determined by local assessors to be the total taxable value of land and additions on the property. | Land | Improvement |
|---|---|---|---|---|
| 2025 | $13,681 | $489,300 | $175,600 | $313,700 |
| 2024 | $13,128 | $489,300 | $175,600 | $313,700 |
| 2023 | $13,128 | $489,300 | $175,600 | $313,700 |
| 2022 | $12,883 | $489,300 | $175,600 | $313,700 |
| 2021 | $12,781 | $489,300 | $175,600 | $313,700 |
| 2020 | $12,555 | $489,300 | $175,600 | $313,700 |
| 2019 | $11,961 | $138,600 | $56,000 | $82,600 |
| 2018 | $11,723 | $138,600 | $56,000 | $82,600 |
| 2017 | $11,419 | $138,600 | $56,000 | $82,600 |
| 2016 | $10,998 | $138,600 | $56,000 | $82,600 |
| 2015 | $10,636 | $138,600 | $56,000 | $82,600 |
| 2014 | $11,823 | $158,800 | $56,000 | $102,800 |
Source: Public Records
Map
Nearby Homes