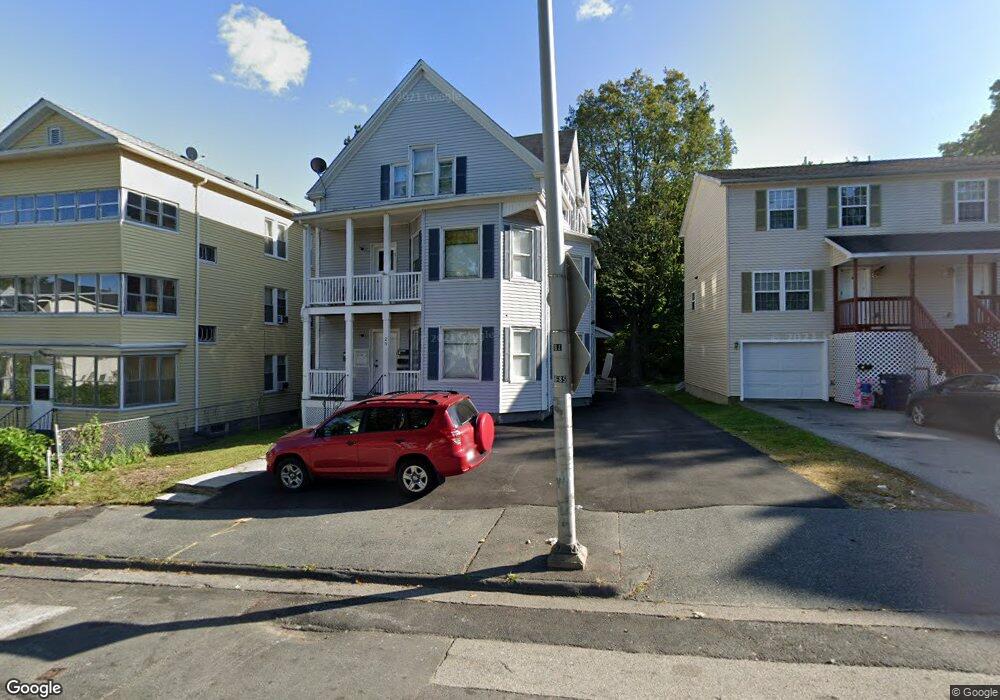
27B Acton St Worcester, MA 01604
Union HIll NeighborhoodEstimated Value: $337,000 - $362,597
3
Beds
2
Baths
1,092
Sq Ft
$320/Sq Ft
Est. Value
About This Home
This home is located at 27B Acton St, Worcester, MA 01604 and is currently estimated at $349,899, approximately $320 per square foot. 27B Acton St is a home located in Worcester County with nearby schools including Jacob Hiatt Magnet School, Chandler Magnet, and Rice Square Elementary School.
Ownership History
Date
Name
Owned For
Owner Type
Purchase Details
Closed on
Jan 15, 2019
Sold by
Boateng Asare and Boateng Margaret
Bought by
Boateng Martin and Boateng Michael
Current Estimated Value
Purchase Details
Closed on
Sep 4, 2008
Sold by
Eshia Joshua
Bought by
Boateng Asare
Home Financials for this Owner
Home Financials are based on the most recent Mortgage that was taken out on this home.
Original Mortgage
$121,500
Interest Rate
6.69%
Mortgage Type
Purchase Money Mortgage
Create a Home Valuation Report for This Property
The Home Valuation Report is an in-depth analysis detailing your home's value as well as a comparison with similar homes in the area
Home Values in the Area
Average Home Value in this Area
Purchase History
| Date | Buyer | Sale Price | Title Company |
|---|---|---|---|
| Boateng Martin | -- | None Available | |
| Boateng Asare | $135,000 | -- |
Source: Public Records
Mortgage History
| Date | Status | Borrower | Loan Amount |
|---|---|---|---|
| Previous Owner | Boateng Asare | $121,500 |
Source: Public Records
Tax History Compared to Growth
Tax History
| Year | Tax Paid | Tax Assessment Tax Assessment Total Assessment is a certain percentage of the fair market value that is determined by local assessors to be the total taxable value of land and additions on the property. | Land | Improvement |
|---|---|---|---|---|
| 2025 | $4,085 | $309,700 | $70,500 | $239,200 |
| 2024 | $3,865 | $281,100 | $70,500 | $210,600 |
| 2023 | $3,708 | $258,600 | $61,300 | $197,300 |
| 2022 | $3,407 | $224,000 | $49,100 | $174,900 |
| 2021 | $3,248 | $199,500 | $39,300 | $160,200 |
| 2020 | $3,188 | $187,500 | $39,000 | $148,500 |
| 2019 | $3,051 | $169,500 | $34,100 | $135,400 |
| 2018 | $3,046 | $161,100 | $34,100 | $127,000 |
| 2017 | $2,845 | $148,000 | $34,100 | $113,900 |
| 2016 | $2,813 | $136,500 | $25,000 | $111,500 |
| 2015 | $2,740 | $136,500 | $25,000 | $111,500 |
| 2014 | $2,667 | $136,500 | $25,000 | $111,500 |
Source: Public Records
Map
Nearby Homes