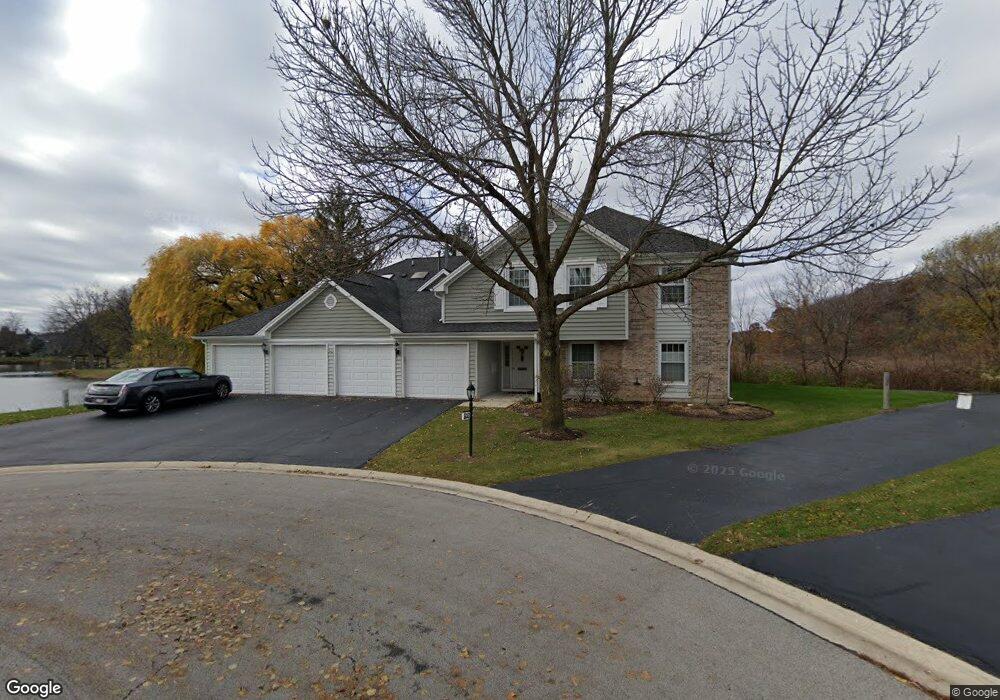
27W718 Windermere Rd Unit 3106 Winfield, IL 60190
Estimated Value: $270,478 - $348,000
--
Bed
--
Bath
1,088
Sq Ft
$272/Sq Ft
Est. Value
About This Home
This home is located at 27W718 Windermere Rd Unit 3106, Winfield, IL 60190 and is currently estimated at $295,620, approximately $271 per square foot. 27W718 Windermere Rd Unit 3106 is a home located in DuPage County with nearby schools including Winfield Central School, Winfield Primary School, and West Chicago Community High School.
Ownership History
Date
Name
Owned For
Owner Type
Purchase Details
Closed on
Sep 20, 2016
Sold by
Spencer Sue A
Bought by
Spencer Sue A and Sue A Spencer Living Trust
Current Estimated Value
Purchase Details
Closed on
Sep 24, 2004
Sold by
Schuchman Lillian F
Bought by
Spencer Sue A
Home Financials for this Owner
Home Financials are based on the most recent Mortgage that was taken out on this home.
Original Mortgage
$100,000
Outstanding Balance
$50,055
Interest Rate
5.93%
Mortgage Type
Purchase Money Mortgage
Estimated Equity
$245,565
Purchase Details
Closed on
Nov 13, 2000
Sold by
Schuchman Lillian F
Bought by
Schuchman Lillian F and Lillian F Schuchman Living Trust
Purchase Details
Closed on
Oct 16, 2000
Sold by
Firstar Bank Na
Bought by
Schuchman Lillian F
Create a Home Valuation Report for This Property
The Home Valuation Report is an in-depth analysis detailing your home's value as well as a comparison with similar homes in the area
Home Values in the Area
Average Home Value in this Area
Purchase History
| Date | Buyer | Sale Price | Title Company |
|---|---|---|---|
| Spencer Sue A | -- | Attorney | |
| Spencer Sue A | $174,000 | Atg | |
| Schuchman Lillian F | -- | -- | |
| Schuchman Lillian F | -- | -- |
Source: Public Records
Mortgage History
| Date | Status | Borrower | Loan Amount |
|---|---|---|---|
| Open | Spencer Sue A | $100,000 |
Source: Public Records
Tax History Compared to Growth
Tax History
| Year | Tax Paid | Tax Assessment Tax Assessment Total Assessment is a certain percentage of the fair market value that is determined by local assessors to be the total taxable value of land and additions on the property. | Land | Improvement |
|---|---|---|---|---|
| 2024 | $4,054 | $70,008 | $14,037 | $55,971 |
| 2023 | $3,788 | $63,940 | $12,820 | $51,120 |
| 2022 | $3,843 | $59,770 | $11,990 | $47,780 |
| 2021 | $2,272 | $57,290 | $11,490 | $45,800 |
| 2020 | $2,306 | $55,550 | $11,140 | $44,410 |
| 2019 | $2,411 | $52,900 | $10,610 | $42,290 |
| 2018 | $2,454 | $50,870 | $10,200 | $40,670 |
| 2017 | $2,525 | $48,330 | $9,690 | $38,640 |
| 2016 | $2,647 | $45,060 | $9,030 | $36,030 |
| 2015 | $2,823 | $41,710 | $8,360 | $33,350 |
| 2014 | $2,897 | $40,300 | $8,110 | $32,190 |
| 2013 | $3,316 | $46,410 | $8,410 | $38,000 |
Source: Public Records
Map
Nearby Homes
- 27W705 Grasmere Dr Unit 1705
- 0N200 Windermere Rd Unit 2702
- 0N069 Windermere Rd Unit 2301
- 0N062 Forsythe Ct
- 0N082 Forsythe Ct
- 28W061 Woodland Dr
- 0S619 Forest Ave
- 27W773 Beecher Ave
- 0S044 Lee Ct
- 27W250 Birch St
- 3 Sunnyside Ave
- 27W180 Cooley Ave
- 27W423 Sunnyside Ave
- 27W277 Waterford Dr
- 0N664 Bedford Ln
- 28W185 Geneva Rd
- 26W537 Barnes Ave
- 27W229 Providence Ln
- 34 S Lake Dr
- 28W605 Barnes Ave
- 0N036 Ambleside Dr Unit 2407
- 0N036 Ambleside Dr Unit 2404
- 27W710 Windermere Rd Unit 3201
- 27W690 Windermere Rd Unit 3303
- 27W701 Windermere Rd Unit 3005
- 27W685 Grasmere Dr Unit 1808
- 27W685 Grasmere Dr Unit 1804
- 27W718 Windermere Rd Unit 3102
- 27W705 Grasmere Dr Unit 1706
- 27W714 Windermere Rd Unit 3208
- 27W714 Windermere Rd Unit 3203
- 27W705 Windermere Rd Unit 3004
- 27W710 Windermere Rd Unit 3206
- 27W710 Windermere Rd Unit 3202
- 27W685 Grasmere Dr Unit 1803
- 27W718 Windermere Rd Unit 3105
- 27W701 Windermere Rd Unit 3002
- 27W714 Windermere Rd Unit 3207
- 27W681 Grasmere Dr Unit 1806
- 27W690 Windermere Rd Unit 3307