Estimated Value: $174,000 - $225,591
2
Beds
1
Bath
970
Sq Ft
$212/Sq Ft
Est. Value
About This Home
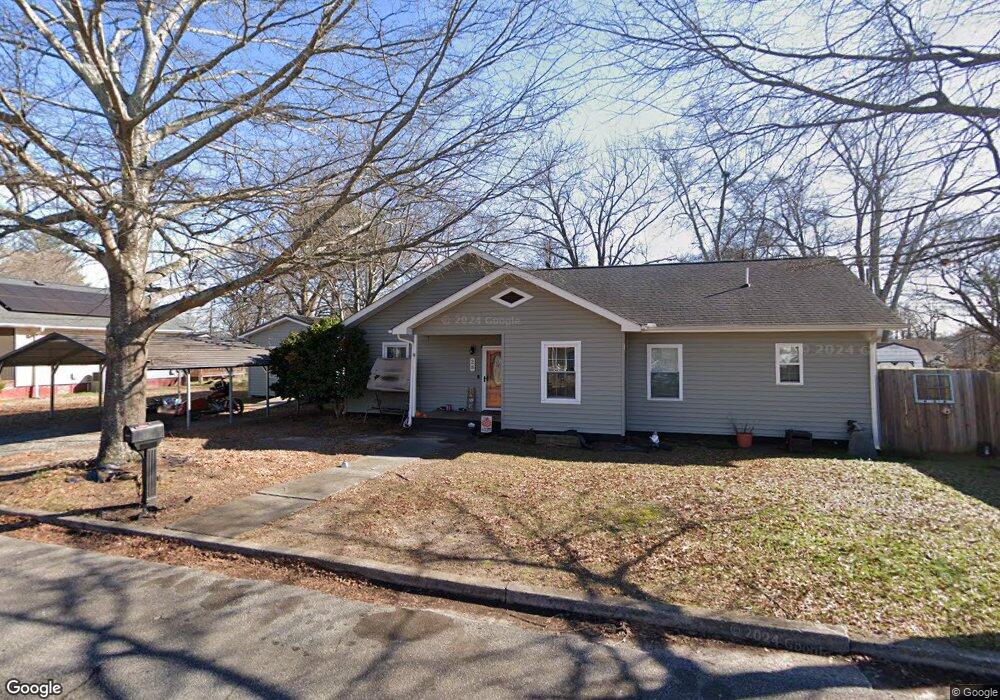
This home is located at 28 3rd St, Inman, SC 29349 and is currently estimated at $205,898, approximately $212 per square foot. 28 3rd St is a home located in Spartanburg County with nearby schools including Inman Elementary School, T.E. Mabry Middle School, and Chapman High School.
Ownership History
Date
Name
Owned For
Owner Type
Purchase Details
Closed on
Jul 28, 2022
Sold by
Byrd Jamie L
Bought by
Woody Landon R and Woody Richelle M
Current Estimated Value
Home Financials for this Owner
Home Financials are based on the most recent Mortgage that was taken out on this home.
Original Mortgage
$196,969
Outstanding Balance
$188,465
Interest Rate
5.78%
Mortgage Type
New Conventional
Estimated Equity
$17,433
Purchase Details
Closed on
Aug 15, 2012
Sold by
Johnson Dennis R and Bryant Wanda J Hammett
Bought by
Byrd Jamie L
Purchase Details
Closed on
Jul 10, 2009
Sold by
Johnson Dennis R and Reynolds Nancy J
Bought by
Byrd Jamie L
Home Financials for this Owner
Home Financials are based on the most recent Mortgage that was taken out on this home.
Original Mortgage
$35,000
Interest Rate
4.88%
Mortgage Type
Seller Take Back
Create a Home Valuation Report for This Property
The Home Valuation Report is an in-depth analysis detailing your home's value as well as a comparison with similar homes in the area
Home Values in the Area
Average Home Value in this Area
Purchase History
| Date | Buyer | Sale Price | Title Company |
|---|---|---|---|
| Woody Landon R | $195,000 | None Listed On Document | |
| Woody Landon R | $195,000 | None Listed On Document | |
| Byrd Jamie L | $40,000 | -- | |
| Byrd Jamie L | $40,000 | -- |
Source: Public Records
Mortgage History
| Date | Status | Borrower | Loan Amount |
|---|---|---|---|
| Open | Woody Landon R | $196,969 | |
| Closed | Woody Landon R | $196,969 | |
| Previous Owner | Byrd Jamie L | $35,000 |
Source: Public Records
Tax History Compared to Growth
Tax History
| Year | Tax Paid | Tax Assessment Tax Assessment Total Assessment is a certain percentage of the fair market value that is determined by local assessors to be the total taxable value of land and additions on the property. | Land | Improvement |
|---|---|---|---|---|
| 2025 | $4,608 | $7,800 | $724 | $7,076 |
| 2024 | $4,608 | $7,800 | $724 | $7,076 |
| 2023 | $4,608 | $11,700 | $1,086 | $10,614 |
| 2022 | $699 | $3,542 | $209 | $3,333 |
| 2021 | $699 | $3,542 | $209 | $3,333 |
| 2020 | $685 | $3,542 | $209 | $3,333 |
| 2019 | $685 | $3,542 | $209 | $3,333 |
| 2018 | $719 | $3,542 | $209 | $3,333 |
| 2017 | $648 | $3,080 | $240 | $2,840 |
| 2016 | $385 | $1,708 | $240 | $1,468 |
| 2015 | $371 | $1,708 | $240 | $1,468 |
| 2014 | $368 | $1,708 | $240 | $1,468 |
Source: Public Records
Map
Nearby Homes
- 15 2nd St
- 12 1st St
- 10 A St
- 14 Wofford St
- Heatherwood Plan at Stones Throw
- Inman Plan at Stones Throw
- Reynolds Plan at Stones Throw
- Quincy Plan at Stones Throw
- Ellison Plan at Stones Throw
- Clifton Plan at Stones Throw
- Wellford Plan at Stones Throw
- Pacific Plan at Stones Throw
- Cheshire Plan at Stones Throw
- Iris Plan at Stones Throw
- Bishop Plan at Stones Throw
- 19 Wofford St
- 4410 New Cut Rd
- 1091 Park Rd
- 4421 New Cut Rd
- 9041 Asheville Hwy