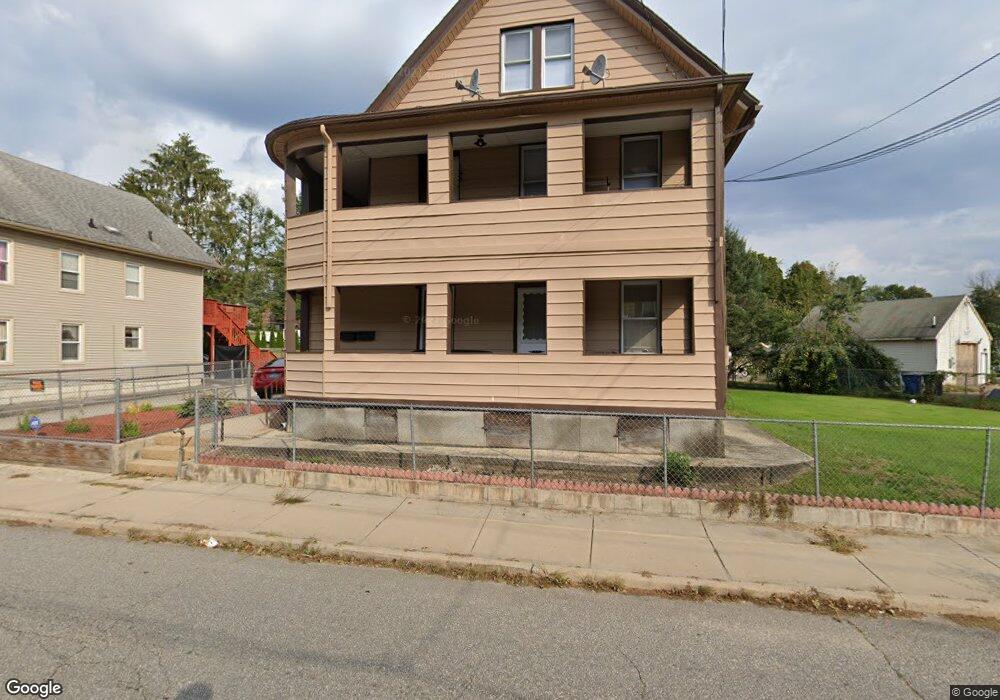
28 Adelbert St Willimantic, CT 06226
Estimated Value: $280,000 - $314,000
4
Beds
3
Baths
1,931
Sq Ft
$153/Sq Ft
Est. Value
About This Home
This home is located at 28 Adelbert St, Willimantic, CT 06226 and is currently estimated at $296,294, approximately $153 per square foot. 28 Adelbert St is a home located in Windham County with nearby schools including Windham Middle School, Windham High School, and St Mary St Joseph School.
Ownership History
Date
Name
Owned For
Owner Type
Purchase Details
Closed on
Oct 7, 2019
Sold by
Rodriguez Dora
Bought by
Pacheco-Mangual Valerie K and Rodriguez Alex A
Current Estimated Value
Home Financials for this Owner
Home Financials are based on the most recent Mortgage that was taken out on this home.
Original Mortgage
$200,305
Outstanding Balance
$175,477
Interest Rate
3.5%
Mortgage Type
FHA
Estimated Equity
$120,817
Purchase Details
Closed on
May 21, 1990
Sold by
Lysak David
Bought by
Macha Ann
Home Financials for this Owner
Home Financials are based on the most recent Mortgage that was taken out on this home.
Original Mortgage
$138,400
Interest Rate
10.14%
Mortgage Type
Purchase Money Mortgage
Purchase Details
Closed on
Oct 16, 1987
Sold by
Walencewicz Peter
Bought by
Lysak David
Home Financials for this Owner
Home Financials are based on the most recent Mortgage that was taken out on this home.
Original Mortgage
$82,500
Interest Rate
10.63%
Mortgage Type
Purchase Money Mortgage
Create a Home Valuation Report for This Property
The Home Valuation Report is an in-depth analysis detailing your home's value as well as a comparison with similar homes in the area
Home Values in the Area
Average Home Value in this Area
Purchase History
| Date | Buyer | Sale Price | Title Company |
|---|---|---|---|
| Pacheco-Mangual Valerie K | $204,000 | -- | |
| Macha Ann | $140,200 | -- | |
| Lysak David | $109,500 | -- |
Source: Public Records
Mortgage History
| Date | Status | Borrower | Loan Amount |
|---|---|---|---|
| Open | Pacheco-Mangual Valerie K | $200,305 | |
| Previous Owner | Lysak David | $54,000 | |
| Previous Owner | Lysak David | $25,450 | |
| Previous Owner | Lysak David | $138,400 | |
| Previous Owner | Lysak David | $82,500 |
Source: Public Records
Tax History
| Year | Tax Paid | Tax Assessment Tax Assessment Total Assessment is a certain percentage of the fair market value that is determined by local assessors to be the total taxable value of land and additions on the property. | Land | Improvement |
|---|---|---|---|---|
| 2025 | $5,864 | $158,400 | $27,110 | $131,290 |
| 2024 | $5,870 | $158,400 | $27,110 | $131,290 |
| 2023 | $3,632 | $76,630 | $23,590 | $53,040 |
| 2022 | $3,579 | $76,630 | $23,590 | $53,040 |
| 2021 | $3,838 | $76,630 | $23,590 | $53,040 |
| 2020 | $3,830 | $76,630 | $23,590 | $53,040 |
| 2019 | $3,768 | $76,630 | $23,590 | $53,040 |
| 2017 | $3,584 | $75,280 | $19,330 | $55,950 |
| 2015 | $3,461 | $75,280 | $19,330 | $55,950 |
| 2014 | $3,269 | $75,280 | $19,330 | $55,950 |
Source: Public Records
Map
Nearby Homes
- 22 Adelbert St
- 29 Boston Post Rd
- 33 Boston Post Rd
- 18 Adelbert St
- 23 Natchaug St
- 9 Natchaug St
- 27 Natchaug St
- 37 Boston Post Rd
- 37 Boston Post Rd
- 37 Boston Post Rd
- 37 Boston Post Rd
- 9 Adelbert St
- 51 Ash St
- 33 Natchaug St
- 49 Ash St
- 24 Natchaug St
- 39 Ash St
- 2 Lafayette St
- 91 Willowbrook St
- 9 Boston Post Rd
Your Personal Tour Guide
Ask me questions while you tour the home.