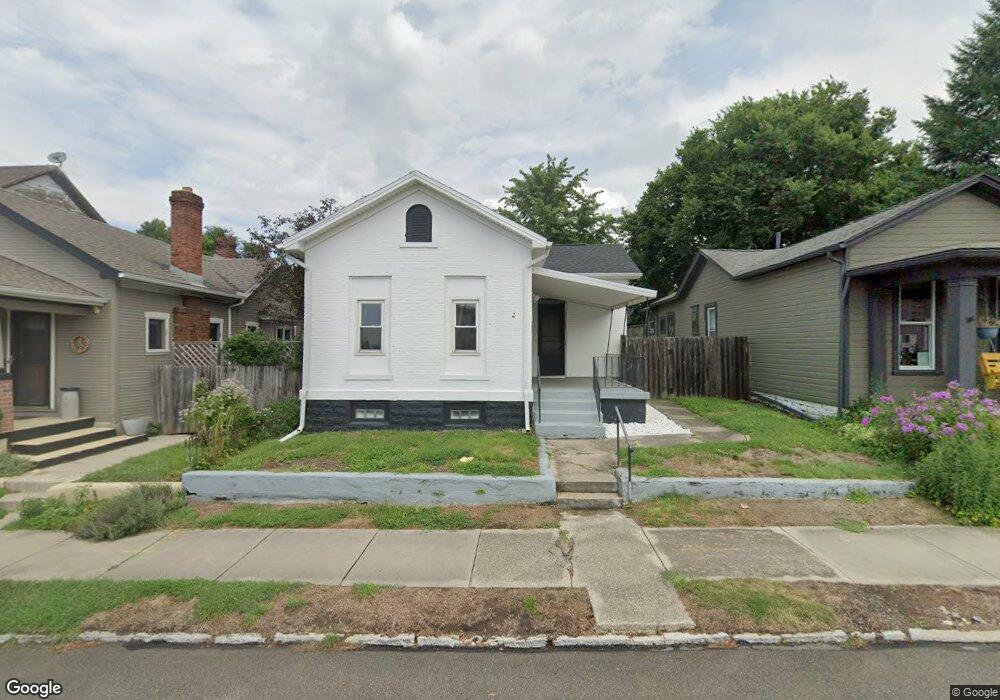
28 Alberta St Dayton, OH 45410
South Park NeighborhoodEstimated Value: $147,000 - $217,000
2
Beds
2
Baths
1,230
Sq Ft
$143/Sq Ft
Est. Value
About This Home
This home is located at 28 Alberta St, Dayton, OH 45410 and is currently estimated at $175,284, approximately $142 per square foot. 28 Alberta St is a home located in Montgomery County with nearby schools including Ruskin Elementary School, Kiser Elementary, and Emerson Academy.
Ownership History
Date
Name
Owned For
Owner Type
Purchase Details
Closed on
Jun 12, 2020
Sold by
Kg Investment Group Llc
Bought by
Giuliani Joseph A
Current Estimated Value
Home Financials for this Owner
Home Financials are based on the most recent Mortgage that was taken out on this home.
Original Mortgage
$149,000
Outstanding Balance
$132,077
Interest Rate
3.2%
Mortgage Type
VA
Estimated Equity
$43,207
Purchase Details
Closed on
Sep 4, 2019
Sold by
Turpin David L and Turpin Janice M
Bought by
Kg Investment Group Llc
Create a Home Valuation Report for This Property
The Home Valuation Report is an in-depth analysis detailing your home's value as well as a comparison with similar homes in the area
Home Values in the Area
Average Home Value in this Area
Purchase History
| Date | Buyer | Sale Price | Title Company |
|---|---|---|---|
| Giuliani Joseph A | $149,000 | Home Services Title Llc | |
| Kg Investment Group Llc | $50,000 | Fidelity Lawyers Ttl Agcy Ll |
Source: Public Records
Mortgage History
| Date | Status | Borrower | Loan Amount |
|---|---|---|---|
| Open | Giuliani Joseph A | $149,000 |
Source: Public Records
Tax History Compared to Growth
Tax History
| Year | Tax Paid | Tax Assessment Tax Assessment Total Assessment is a certain percentage of the fair market value that is determined by local assessors to be the total taxable value of land and additions on the property. | Land | Improvement |
|---|---|---|---|---|
| 2024 | $2,352 | $40,860 | $12,400 | $28,460 |
| 2023 | $2,352 | $40,860 | $12,400 | $28,460 |
| 2022 | $2,259 | $30,310 | $9,190 | $21,120 |
| 2021 | $2,306 | $30,310 | $9,190 | $21,120 |
| 2020 | $2,243 | $30,310 | $9,190 | $21,120 |
| 2019 | $1,490 | $17,370 | $9,190 | $8,180 |
| 2018 | $1,492 | $17,370 | $9,190 | $8,180 |
| 2017 | $1,481 | $17,370 | $9,190 | $8,180 |
| 2016 | $1,615 | $18,110 | $9,190 | $8,920 |
| 2015 | $1,531 | $18,110 | $9,190 | $8,920 |
| 2014 | $1,531 | $28,130 | $9,190 | $18,940 |
| 2012 | -- | $14,270 | $9,090 | $5,180 |
Source: Public Records
Map
Nearby Homes