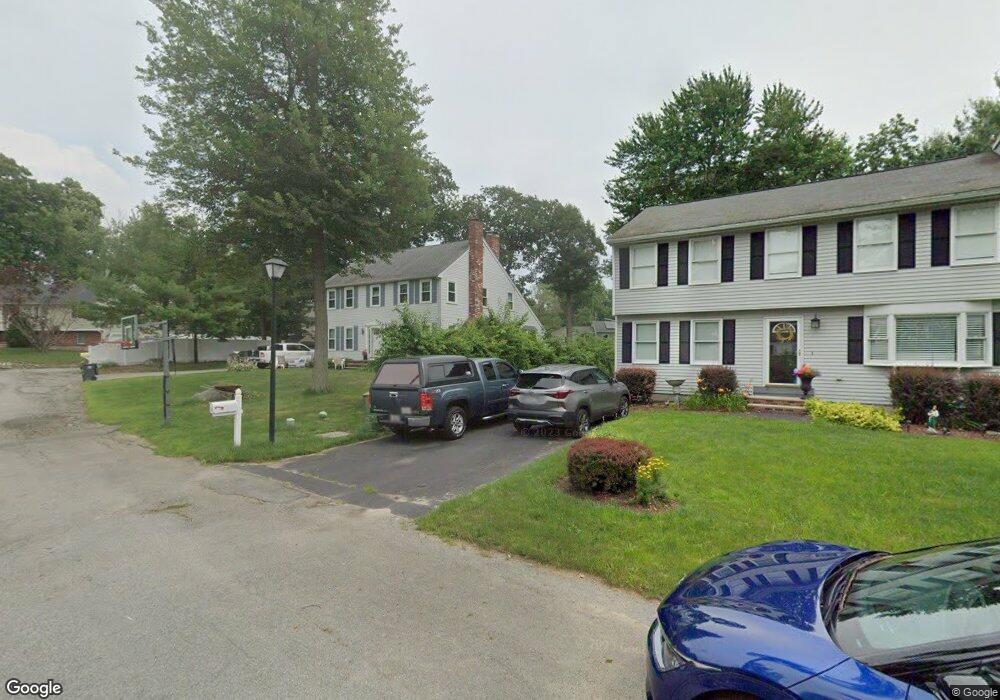
28 Alderbrook Ln Methuen, MA 01844
The East End NeighborhoodEstimated Value: $563,000 - $731,000
3
Beds
2
Baths
1,666
Sq Ft
$387/Sq Ft
Est. Value
About This Home
This home is located at 28 Alderbrook Ln, Methuen, MA 01844 and is currently estimated at $645,326, approximately $387 per square foot. 28 Alderbrook Ln is a home located in Essex County with nearby schools including Timony Grammar School, Methuen High School, and Community Day Charter Public School - Gateway.
Ownership History
Date
Name
Owned For
Owner Type
Purchase Details
Closed on
Oct 29, 1993
Sold by
Brickyard Rt
Bought by
Birch Robert R
Current Estimated Value
Home Financials for this Owner
Home Financials are based on the most recent Mortgage that was taken out on this home.
Original Mortgage
$124,900
Interest Rate
6.86%
Mortgage Type
Purchase Money Mortgage
Purchase Details
Closed on
Mar 21, 1988
Sold by
Dagata Alfio
Bought by
Appleton Est Lp
Create a Home Valuation Report for This Property
The Home Valuation Report is an in-depth analysis detailing your home's value as well as a comparison with similar homes in the area
Home Values in the Area
Average Home Value in this Area
Purchase History
| Date | Buyer | Sale Price | Title Company |
|---|---|---|---|
| Birch Robert R | $149,900 | -- | |
| Birch Robert R | $149,900 | -- | |
| Appleton Est Lp | $125,000 | -- |
Source: Public Records
Mortgage History
| Date | Status | Borrower | Loan Amount |
|---|---|---|---|
| Open | Appleton Est Lp | $21,000 | |
| Closed | Appleton Est Lp | $124,900 |
Source: Public Records
Tax History Compared to Growth
Tax History
| Year | Tax Paid | Tax Assessment Tax Assessment Total Assessment is a certain percentage of the fair market value that is determined by local assessors to be the total taxable value of land and additions on the property. | Land | Improvement |
|---|---|---|---|---|
| 2025 | $6,030 | $569,900 | $254,600 | $315,300 |
| 2024 | $5,980 | $550,600 | $231,500 | $319,100 |
| 2023 | $5,772 | $493,300 | $206,700 | $286,600 |
| 2022 | $5,357 | $410,500 | $165,300 | $245,200 |
| 2021 | $5,045 | $382,500 | $157,100 | $225,400 |
| 2020 | $5,006 | $372,500 | $157,100 | $215,400 |
| 2019 | $4,958 | $349,400 | $148,800 | $200,600 |
| 2018 | $4,840 | $339,200 | $148,800 | $190,400 |
| 2017 | $4,717 | $322,000 | $148,800 | $173,200 |
| 2016 | $4,718 | $318,600 | $148,800 | $169,800 |
Source: Public Records
Map
Nearby Homes
- 4 Alderbrook Ln
- 5 Harmony Ln
- 63 Lippold St
- 5 Weisner Pkwy
- 15 Swan Ave
- 24 Court St
- 35 Swan Ave
- 29 Meadowbrook Rd
- 9 Boylston St
- 24 Boylston St
- 3 Woekel Terrace
- 37 Albion St
- 3 Thissell St
- 43 Duston Dr
- 68 Wesley St
- 106 Leroy Ave
- 167 Ferry 53 Mann St Unit 2,5,6
- 35 Kendall St
- 20 Knox St Unit 43
- 20 Knox St Unit 23