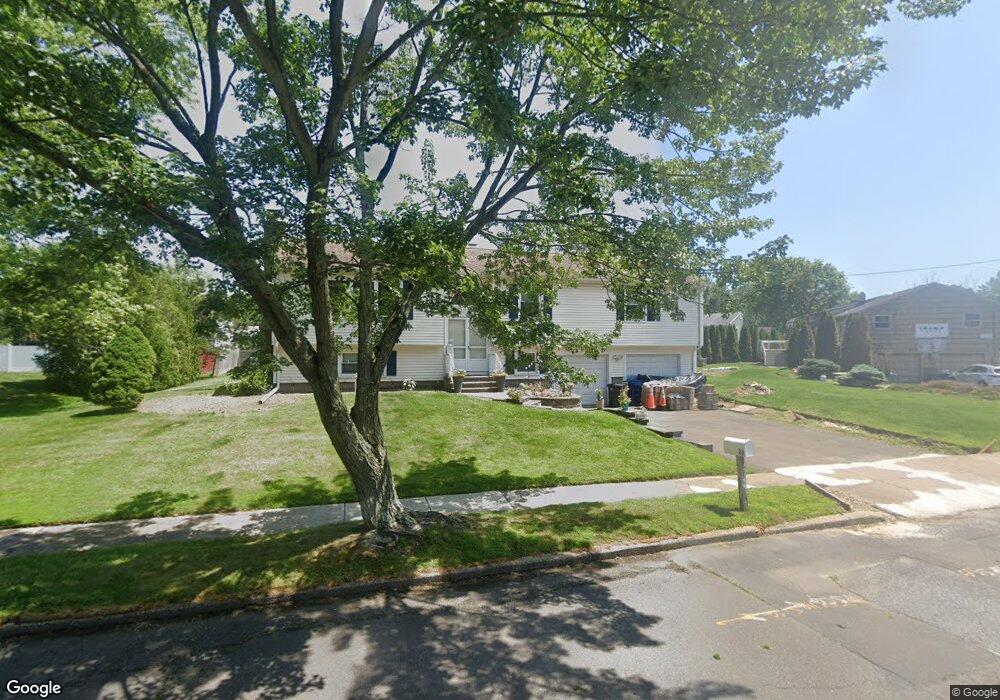
28 Alexander Dr West Haven, CT 06516
West Shore NeighborhoodEstimated Value: $412,000 - $458,000
4
Beds
3
Baths
1,418
Sq Ft
$308/Sq Ft
Est. Value
About This Home
This home is located at 28 Alexander Dr, West Haven, CT 06516 and is currently estimated at $436,508, approximately $307 per square foot. 28 Alexander Dr is a home located in New Haven County with nearby schools including Carrigan 5/6 Intermediate School, Harry M. Bailey Middle School, and West Haven High School.
Ownership History
Date
Name
Owned For
Owner Type
Purchase Details
Closed on
Aug 29, 2024
Sold by
Meyer-Franz Beth
Bought by
Richardson Cheryl and Mayberry Raymond
Current Estimated Value
Home Financials for this Owner
Home Financials are based on the most recent Mortgage that was taken out on this home.
Original Mortgage
$338,751
Outstanding Balance
$334,965
Interest Rate
6.5%
Mortgage Type
FHA
Estimated Equity
$101,543
Purchase Details
Closed on
Oct 2, 2014
Sold by
Franz Paul T
Bought by
Franz Beth M
Purchase Details
Closed on
Dec 12, 1996
Sold by
Delvasto Vincent J and Delvasto Patricia A
Bought by
Franz Paul T and Meyer-Franz Beth
Home Financials for this Owner
Home Financials are based on the most recent Mortgage that was taken out on this home.
Original Mortgage
$147,495
Interest Rate
7.75%
Mortgage Type
Purchase Money Mortgage
Create a Home Valuation Report for This Property
The Home Valuation Report is an in-depth analysis detailing your home's value as well as a comparison with similar homes in the area
Home Values in the Area
Average Home Value in this Area
Purchase History
| Date | Buyer | Sale Price | Title Company |
|---|---|---|---|
| Richardson Cheryl | $345,000 | None Available | |
| Richardson Cheryl | $345,000 | None Available | |
| Franz Beth M | -- | -- | |
| Franz Paul T | $150,000 | -- | |
| Franz Beth M | -- | -- | |
| Franz Paul T | $150,000 | -- |
Source: Public Records
Mortgage History
| Date | Status | Borrower | Loan Amount |
|---|---|---|---|
| Open | Richardson Cheryl | $338,751 | |
| Closed | Richardson Cheryl | $338,751 | |
| Previous Owner | Franz Paul T | $142,500 | |
| Previous Owner | Franz Paul T | $147,495 |
Source: Public Records
Tax History
| Year | Tax Paid | Tax Assessment Tax Assessment Total Assessment is a certain percentage of the fair market value that is determined by local assessors to be the total taxable value of land and additions on the property. | Land | Improvement |
|---|---|---|---|---|
| 2025 | $10,540 | $320,670 | $90,790 | $229,880 |
| 2024 | $9,634 | $205,590 | $62,930 | $142,660 |
| 2023 | $9,272 | $205,590 | $62,930 | $142,660 |
| 2022 | $9,106 | $205,590 | $62,930 | $142,660 |
| 2021 | $9,106 | $205,590 | $62,930 | $142,660 |
| 2020 | $9,133 | $187,880 | $58,380 | $129,500 |
| 2019 | $8,841 | $187,880 | $58,380 | $129,500 |
| 2018 | $8,716 | $187,880 | $58,380 | $129,500 |
| 2017 | $8,481 | $187,880 | $58,380 | $129,500 |
| 2016 | $8,387 | $187,880 | $58,380 | $129,500 |
| 2015 | $8,283 | $207,690 | $62,160 | $145,530 |
| 2014 | $8,283 | $207,690 | $62,160 | $145,530 |
Source: Public Records
Map
Nearby Homes
- 22 Parker Ave
- 74 Wilson Ave
- 99 Roosevelt Ave
- 19 Harding Ave
- 206 Highland Ave
- 100 Prindle Rd
- 18 Albion Ave
- 118 Arlington St
- 16 Sorensen Rd
- 41 Grove Place
- 79 Claudia Dr Unit 354
- 51 Woody Ln
- 70 Edward St
- 45 Arlington St
- 157 Bull Hill Ln Unit 102
- 155 Bull Hill Ln Unit 201
- 53 Pheasant Rd
- 68 Eagle Place
- 19 Kaye Rd
- 920 Ocean Ave Unit E1
- 26 Alexander Dr
- 30 Alexander Dr
- 15 Middlefield Rd
- 32 Alexander Dr
- 13 Middlefield Rd
- 35 Alexander Dr
- 33 Alexander Dr
- 24 Alexander Dr
- 11 Middlefield Rd
- 37 Alexander Dr
- 31 Alexander Dr
- 41 Alexander Dr
- 22 Alexander Dr
- 14 Middlefield Rd
- 47 Alexander Dr
- 9 Middlefield Rd
- 29 Alexander Dr
- 12 Middlefield Rd
- 43 Alexander Dr
Your Personal Tour Guide
Ask me questions while you tour the home.