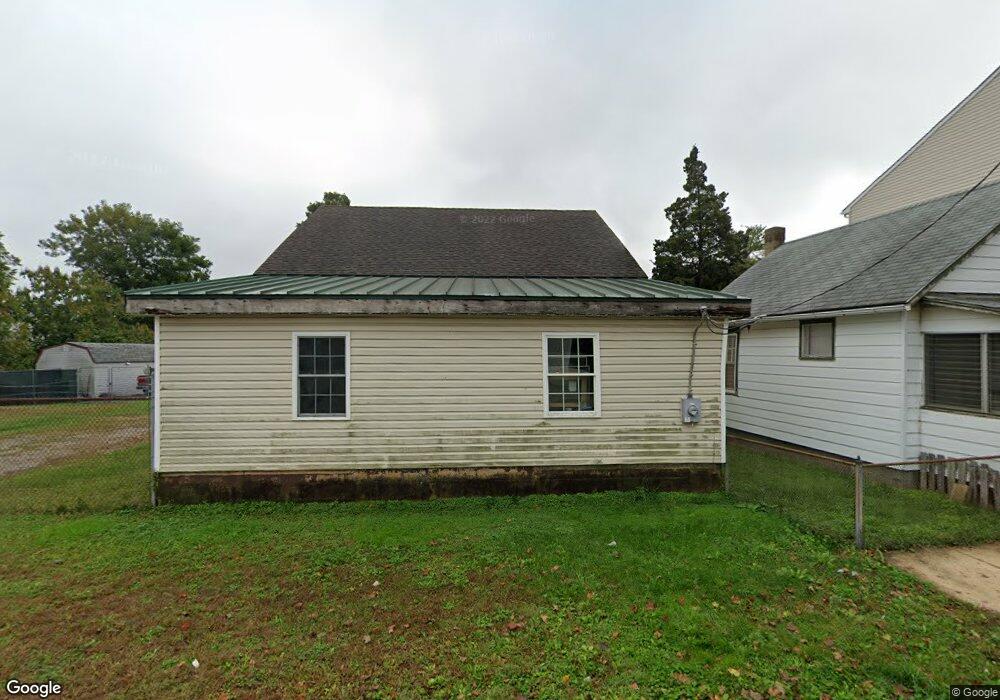
28 Anderson St Middletown, DE 19709
Estimated Value: $111,000
Studio
--
Bath
1,590
Sq Ft
$70/Sq Ft
Est. Value
About This Home
This home is located at 28 Anderson St, Middletown, DE 19709 and is currently priced at $111,000, approximately $69 per square foot. 28 Anderson St is a home located in New Castle County with nearby schools including Silver Lake Elementary School, Louis L. Redding Middle School, and Appoquinimink High School.
Ownership History
Date
Name
Owned For
Owner Type
Purchase Details
Closed on
Jan 28, 2021
Sold by
Yale Avenue Group Llc
Bought by
Alkis Group Real Estate Inc
Current Estimated Value
Purchase Details
Closed on
Aug 7, 2002
Sold by
Stewart John W
Bought by
Yale Avenue Group Llc
Home Financials for this Owner
Home Financials are based on the most recent Mortgage that was taken out on this home.
Original Mortgage
$180,000
Interest Rate
6.58%
Create a Home Valuation Report for This Property
The Home Valuation Report is an in-depth analysis detailing your home's value as well as a comparison with similar homes in the area
Home Values in the Area
Average Home Value in this Area
Purchase History
We collect this data history from publicly available records. To have your information removed, we recommend requesting removal directly through your county’s website.
| Date | Buyer | Sale Price | Title Company |
|---|---|---|---|
| Alkis Group Real Estate Inc | -- | None Available | |
| Yale Avenue Group Llc | $80,000 | -- |
Source: Public Records
Mortgage History
We collect this data history from publicly available records. To have your information removed, we recommend requesting removal directly through your county’s website.
| Date | Status | Borrower | Loan Amount |
|---|---|---|---|
| Previous Owner | Yale Avenue Group Llc | $180,000 |
Source: Public Records
Tax History
| Year | Tax Paid | Tax Assessment Tax Assessment Total Assessment is a certain percentage of the fair market value that is determined by local assessors to be the total taxable value of land and additions on the property. | Land | Improvement |
|---|---|---|---|---|
| 2025 | $729 | $129,900 | $129,000 | $900 |
| 2024 | $65 | $21,600 | $9,100 | $12,500 |
| 2023 | $65 | $21,600 | $9,100 | $12,500 |
| 2022 | $664 | $21,600 | $9,100 | $12,500 |
| 2021 | $650 | $21,600 | $9,100 | $12,500 |
| 2020 | $642 | $21,600 | $9,100 | $12,500 |
| 2019 | $595 | $21,600 | $9,100 | $12,500 |
| 2018 | $569 | $21,600 | $9,100 | $12,500 |
| 2017 | $65 | $21,600 | $9,100 | $12,500 |
| 2016 | $557 | $21,600 | $9,100 | $12,500 |
| 2015 | $65 | $21,600 | $9,100 | $12,500 |
| 2014 | $540 | $21,600 | $9,100 | $12,500 |
Source: Public Records
Map
Nearby Homes
- 8 Crawford St
- 113 Crawford St
- 8 Redding Cir
- 3 Redding Cir
- 12 E Cochran St
- 535 Janvier Dr
- 25 Franklin Dr
- 659 Warren Dr
- 308 New St
- 60 S Cummings Dr
- 541 Diamond Dr
- 38 N Cummings Dr
- 40 S Cummings Dr
- 284 Liborio Dr
- 134 Redden Ln
- 303 Liborio Dr
- 224 Liborio Dr
- 906 S Vernon St
- 29 W Reybold Dr
- 913 S Scott St
Your Personal Tour Guide
Ask me questions while you tour the home.