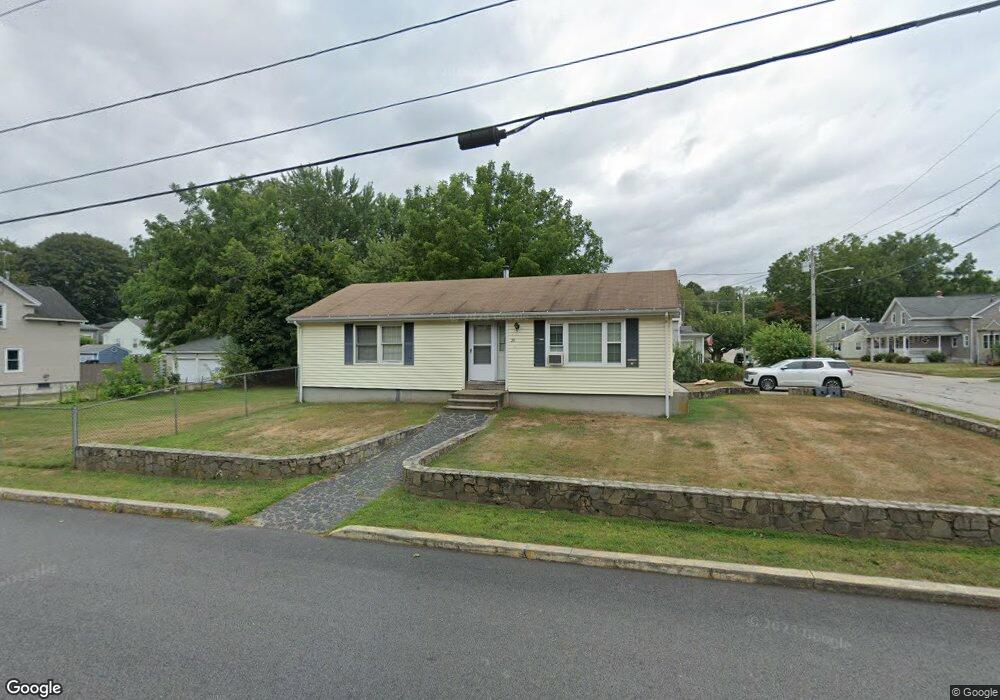
28 Andrews Ave West Warwick, RI 02893
West Warwick Centre NeighborhoodEstimated Value: $369,000 - $386,216
2
Beds
2
Baths
1,139
Sq Ft
$333/Sq Ft
Est. Value
About This Home
This home is located at 28 Andrews Ave, West Warwick, RI 02893 and is currently estimated at $378,804, approximately $332 per square foot. 28 Andrews Ave is a home located in Kent County with nearby schools including West Warwick High School.
Ownership History
Date
Name
Owned For
Owner Type
Purchase Details
Closed on
Aug 15, 1997
Sold by
Bedrossian Edward F and Bedrossian Mary
Bought by
Bedrossian Frank E and Bedrossian Elaine
Current Estimated Value
Home Financials for this Owner
Home Financials are based on the most recent Mortgage that was taken out on this home.
Original Mortgage
$85,000
Interest Rate
7.56%
Create a Home Valuation Report for This Property
The Home Valuation Report is an in-depth analysis detailing your home's value as well as a comparison with similar homes in the area
Home Values in the Area
Average Home Value in this Area
Purchase History
| Date | Buyer | Sale Price | Title Company |
|---|---|---|---|
| Bedrossian Frank E | $85,000 | -- |
Source: Public Records
Mortgage History
| Date | Status | Borrower | Loan Amount |
|---|---|---|---|
| Open | Bedrossian Frank E | $140,000 | |
| Closed | Bedrossian Frank E | $50,000 | |
| Closed | Bedrossian Frank E | $85,000 |
Source: Public Records
Tax History Compared to Growth
Tax History
| Year | Tax Paid | Tax Assessment Tax Assessment Total Assessment is a certain percentage of the fair market value that is determined by local assessors to be the total taxable value of land and additions on the property. | Land | Improvement |
|---|---|---|---|---|
| 2025 | $4,751 | $332,500 | $84,300 | $248,200 |
| 2024 | $4,523 | $242,000 | $53,500 | $188,500 |
| 2023 | $4,433 | $242,000 | $53,500 | $188,500 |
| 2022 | $4,366 | $242,000 | $53,500 | $188,500 |
| 2021 | $4,248 | $184,700 | $44,000 | $140,700 |
| 2020 | $4,248 | $184,700 | $44,000 | $140,700 |
| 2019 | $5,415 | $184,700 | $44,000 | $140,700 |
| 2018 | $3,759 | $138,300 | $41,300 | $97,000 |
| 2017 | $3,639 | $138,300 | $41,300 | $97,000 |
| 2016 | $3,574 | $138,300 | $41,300 | $97,000 |
| 2015 | $3,460 | $133,300 | $41,300 | $92,000 |
| 2014 | $3,384 | $133,300 | $41,300 | $92,000 |
Source: Public Records
Map
Nearby Homes