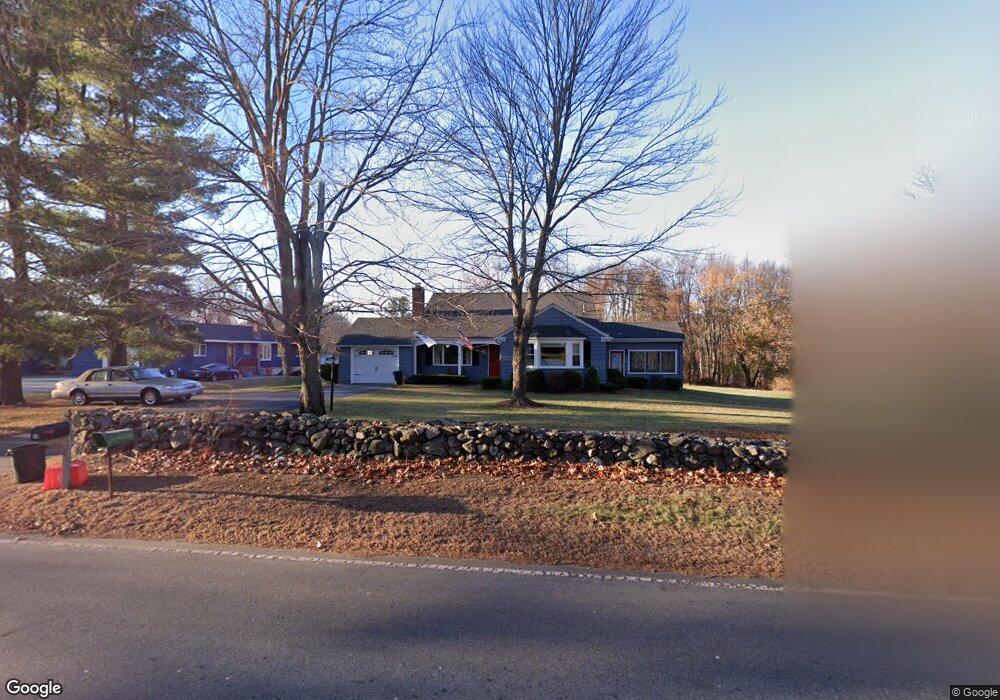
28 Appleton St North Andover, MA 01845
Estimated Value: $736,556 - $852,000
3
Beds
2
Baths
1,791
Sq Ft
$434/Sq Ft
Est. Value
About This Home
This home is located at 28 Appleton St, North Andover, MA 01845 and is currently estimated at $778,139, approximately $434 per square foot. 28 Appleton St is a home located in Essex County with nearby schools including Franklin Elementary School, North Andover Middle School, and North Andover High School.
Ownership History
Date
Name
Owned For
Owner Type
Purchase Details
Closed on
Nov 13, 2025
Sold by
Jeknavorian John Est and Jeknavorian
Bought by
Jeknavorian Karen M
Current Estimated Value
Purchase Details
Closed on
Oct 28, 1988
Sold by
Enaire Dorothy C
Bought by
Jeknavorian John
Home Financials for this Owner
Home Financials are based on the most recent Mortgage that was taken out on this home.
Original Mortgage
$99,000
Interest Rate
10.32%
Mortgage Type
Purchase Money Mortgage
Create a Home Valuation Report for This Property
The Home Valuation Report is an in-depth analysis detailing your home's value as well as a comparison with similar homes in the area
Home Values in the Area
Average Home Value in this Area
Purchase History
| Date | Buyer | Sale Price | Title Company |
|---|---|---|---|
| Jeknavorian Karen M | -- | -- | |
| Jeknavorian John | $221,500 | -- |
Source: Public Records
Mortgage History
| Date | Status | Borrower | Loan Amount |
|---|---|---|---|
| Previous Owner | Jeknavorian John | $99,000 |
Source: Public Records
Tax History
| Year | Tax Paid | Tax Assessment Tax Assessment Total Assessment is a certain percentage of the fair market value that is determined by local assessors to be the total taxable value of land and additions on the property. | Land | Improvement |
|---|---|---|---|---|
| 2025 | $7,111 | $631,500 | $372,300 | $259,200 |
| 2024 | $6,762 | $609,700 | $350,500 | $259,200 |
| 2023 | $6,819 | $557,100 | $321,900 | $235,200 |
| 2022 | $6,750 | $498,900 | $289,200 | $209,700 |
| 2021 | $6,471 | $456,700 | $263,100 | $193,600 |
| 2020 | $6,099 | $443,900 | $263,100 | $180,800 |
| 2019 | $5,953 | $443,900 | $263,100 | $180,800 |
| 2018 | $6,450 | $443,900 | $263,100 | $180,800 |
| 2017 | $5,349 | $374,600 | $208,200 | $166,400 |
| 2016 | $5,026 | $352,200 | $204,300 | $147,900 |
| 2015 | $4,969 | $345,300 | $201,000 | $144,300 |
Source: Public Records
Map
Nearby Homes
- 445 Salem St
- 45 Thistle Rd
- 88 Johnson St
- 61 Abbott St
- 447 Stevens St
- 3 Great Pond Rd
- 71 Regency Place
- 124 Quail Run Rd
- 136 Quail Run Rd
- 86 Andover St
- 42 Hewitt Ave
- 115 Mill Pond
- 16 Court St
- 12 Mill Pond Unit 12
- 10 Bridle Path
- 8 Fernview Ave Unit 5
- 65 Saile Way
- 19 Fernview Ave Unit 6
- 19 Fernview Ave Unit 5
- 70 Farrwood Ave Unit 7
Your Personal Tour Guide
Ask me questions while you tour the home.