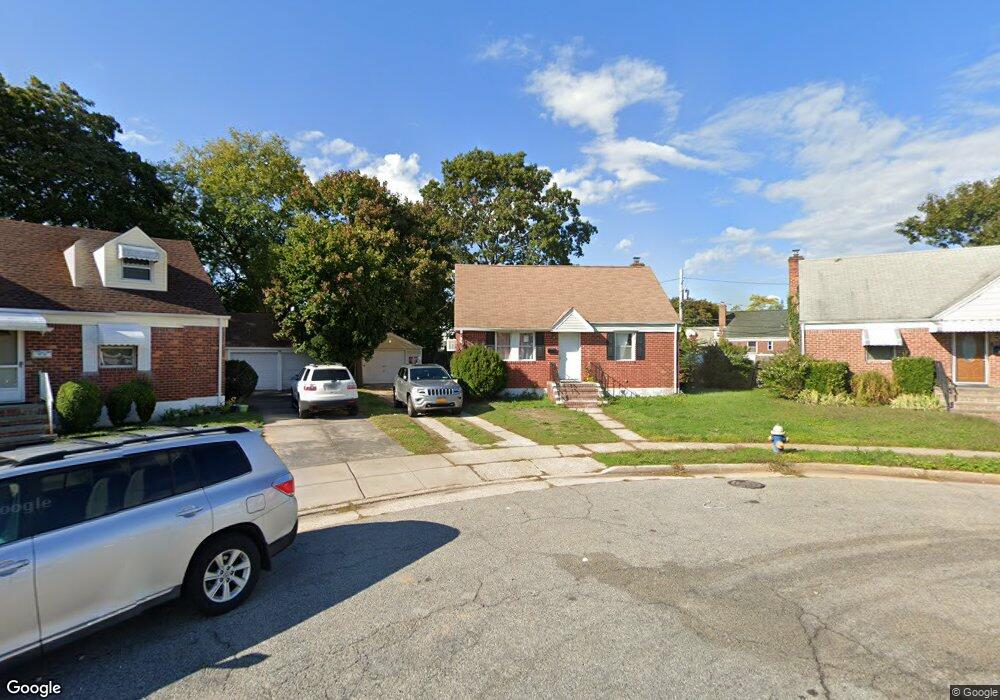
28 Ash Ct Hempstead, NY 11550
Estimated Value: $587,000 - $614,536
4
Beds
2
Baths
1,075
Sq Ft
$559/Sq Ft
Est. Value
About This Home
This home is located at 28 Ash Ct, Hempstead, NY 11550 and is currently estimated at $600,768, approximately $558 per square foot. 28 Ash Ct is a home located in Nassau County with nearby schools including Evergreen Charter School and Crescent School.
Ownership History
Date
Name
Owned For
Owner Type
Purchase Details
Closed on
Jun 13, 2017
Sold by
Referee Of Nassau County and Burcheri Esq Russell
Bought by
Wells Fargo Bank Na
Current Estimated Value
Purchase Details
Closed on
Feb 10, 2012
Sold by
Jbr Industries Corpration
Bought by
Stephenson Yvonne E
Purchase Details
Closed on
May 18, 2011
Sold by
Us Bank National Association
Bought by
Jbr Industries Corp
Home Financials for this Owner
Home Financials are based on the most recent Mortgage that was taken out on this home.
Original Mortgage
$142,000
Interest Rate
4.62%
Mortgage Type
Purchase Money Mortgage
Purchase Details
Closed on
May 26, 1999
Sold by
Watkins James E and Watkins Arleathia M
Bought by
Watkins James E
Home Financials for this Owner
Home Financials are based on the most recent Mortgage that was taken out on this home.
Original Mortgage
$135,450
Interest Rate
7.49%
Mortgage Type
Purchase Money Mortgage
Create a Home Valuation Report for This Property
The Home Valuation Report is an in-depth analysis detailing your home's value as well as a comparison with similar homes in the area
Home Values in the Area
Average Home Value in this Area
Purchase History
| Date | Buyer | Sale Price | Title Company |
|---|---|---|---|
| Wells Fargo Bank Na | $191,250 | None Available | |
| Stephenson Yvonne E | $222,340 | Jbr Industries Corpration | |
| Jbr Industries Corp | $129,000 | -- | |
| Watkins James E | -- | Fidelity National Title Ins |
Source: Public Records
Mortgage History
| Date | Status | Borrower | Loan Amount |
|---|---|---|---|
| Previous Owner | Jbr Industries Corp | $142,000 | |
| Previous Owner | Watkins James E | $135,450 |
Source: Public Records
Tax History
| Year | Tax Paid | Tax Assessment Tax Assessment Total Assessment is a certain percentage of the fair market value that is determined by local assessors to be the total taxable value of land and additions on the property. | Land | Improvement |
|---|---|---|---|---|
| 2025 | $7,944 | $313 | $112 | $201 |
| 2024 | $840 | $313 | $112 | $201 |
Source: Public Records
Map
Nearby Homes
- 15 Circle Dr
- 69 Glenmore Ave
- 77 Virginia Ave
- 106 W Marshall St
- 3840 Linden Place
- 159 Alabama Ave
- 206 W Marshall St
- 54 W Marshall St
- 45 Alabama Ave
- 22 Mason St
- 86 Linden Ave
- 39 Botsford St
- 29 Sterling Place
- 33 Linden Ave
- 23 Peters Ave
- 44 Nassau Pkwy
- 46 Peters Ave
- 36 Monroe Place
- 182 Long Beach Rd
- 28 Elizabeth Ave
Your Personal Tour Guide
Ask me questions while you tour the home.