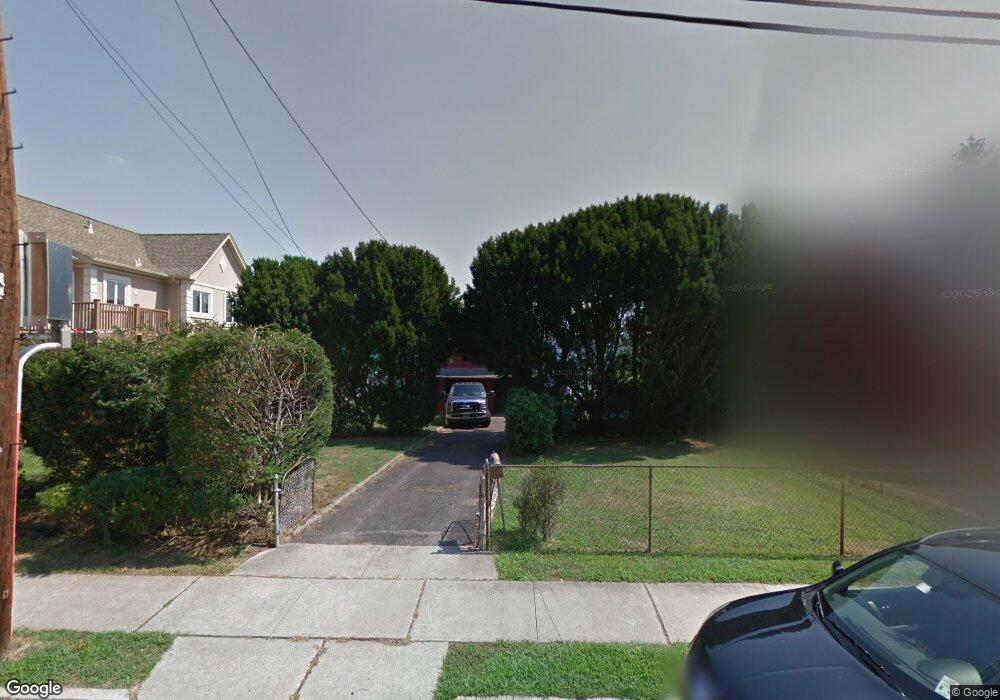
28 Banta Ave Garfield, NJ 07026
Estimated Value: $1,119,157 - $1,812,000
--
Bed
--
Bath
3,400
Sq Ft
$401/Sq Ft
Est. Value
About This Home
This home is located at 28 Banta Ave, Garfield, NJ 07026 and is currently estimated at $1,363,386, approximately $400 per square foot. 28 Banta Ave is a home located in Bergen County with nearby schools including Garfield High School and Rainbow Montessori School - Clifton.
Ownership History
Date
Name
Owned For
Owner Type
Purchase Details
Closed on
May 9, 2022
Sold by
Muhammed Karaca
Bought by
Karaca Muhammed
Current Estimated Value
Home Financials for this Owner
Home Financials are based on the most recent Mortgage that was taken out on this home.
Original Mortgage
$707,595
Interest Rate
4.72%
Mortgage Type
New Conventional
Purchase Details
Closed on
Sep 15, 2016
Sold by
28 Banta Ave Lc
Bought by
Karaca Muhammed
Home Financials for this Owner
Home Financials are based on the most recent Mortgage that was taken out on this home.
Original Mortgage
$726,596
Interest Rate
3.52%
Mortgage Type
FHA
Purchase Details
Closed on
Nov 13, 2014
Sold by
Servas Raymond T and Selvaggio Anthony J
Bought by
28 Banta Ave Llc
Create a Home Valuation Report for This Property
The Home Valuation Report is an in-depth analysis detailing your home's value as well as a comparison with similar homes in the area
Home Values in the Area
Average Home Value in this Area
Purchase History
| Date | Buyer | Sale Price | Title Company |
|---|---|---|---|
| Karaca Muhammed | -- | Bona Fide Title | |
| Karaca Muhammed | $782,500 | Title Insurance Commitment | |
| 28 Banta Ave Llc | $160,000 | Vested Land Sevices Llc |
Source: Public Records
Mortgage History
| Date | Status | Borrower | Loan Amount |
|---|---|---|---|
| Previous Owner | Karaca Muhammed | $707,595 | |
| Previous Owner | Karaca Muhammed | $726,596 |
Source: Public Records
Tax History Compared to Growth
Tax History
| Year | Tax Paid | Tax Assessment Tax Assessment Total Assessment is a certain percentage of the fair market value that is determined by local assessors to be the total taxable value of land and additions on the property. | Land | Improvement |
|---|---|---|---|---|
| 2025 | $21,614 | $647,700 | $123,500 | $524,200 |
| 2024 | $21,251 | $647,700 | $123,500 | $524,200 |
| 2023 | $20,202 | $647,700 | $123,500 | $524,200 |
| 2022 | $20,124 | $645,200 | $123,500 | $521,700 |
| 2021 | $19,537 | $645,200 | $123,500 | $521,700 |
| 2020 | $19,111 | $645,200 | $123,500 | $521,700 |
| 2019 | $18,750 | $645,200 | $123,500 | $521,700 |
| 2018 | $18,330 | $645,200 | $123,500 | $521,700 |
| 2017 | $18,008 | $645,200 | $123,500 | $521,700 |
| 2016 | $4,146 | $153,100 | $123,500 | $29,600 |
| 2015 | $4,043 | $153,100 | $123,500 | $29,600 |
| 2014 | $3,936 | $153,100 | $123,500 | $29,600 |
Source: Public Records
Map
Nearby Homes