28 Barker St North Dartmouth, MA 02747
Smith Mills NeighborhoodEstimated Value: $538,000 - $570,000
3
Beds
2
Baths
1,536
Sq Ft
$357/Sq Ft
Est. Value
About This Home
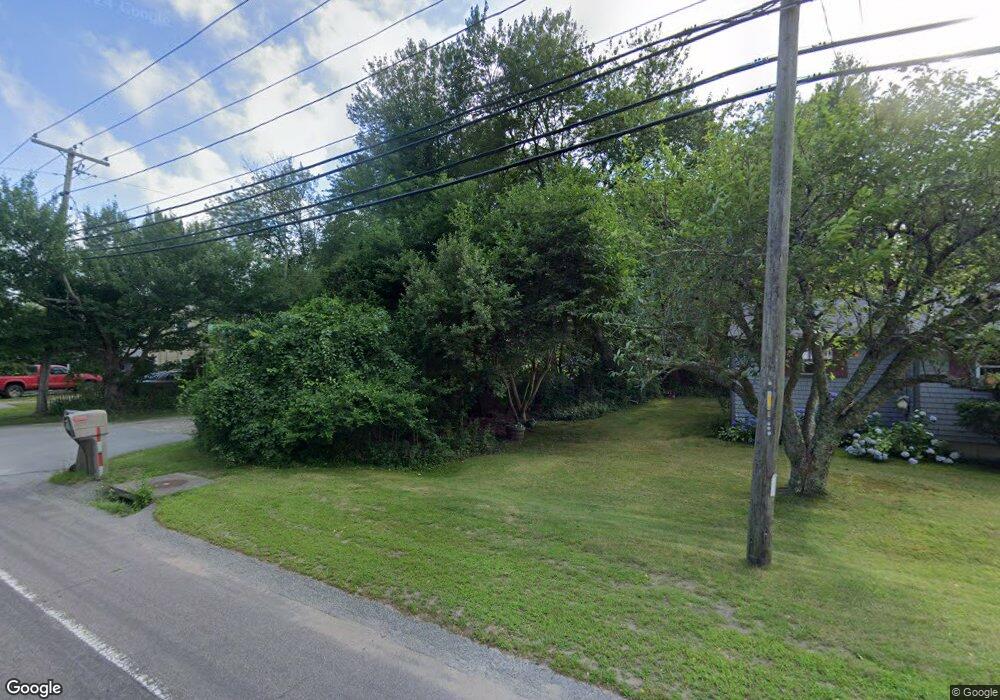
This home is located at 28 Barker St, North Dartmouth, MA 02747 and is currently estimated at $548,853, approximately $357 per square foot. 28 Barker St is a home located in Bristol County with nearby schools including Dartmouth High School, Nazarene Christian Academy, and Friends Academy.
Ownership History
Date
Name
Owned For
Owner Type
Purchase Details
Closed on
Jun 28, 2019
Sold by
Conforti Carl J
Bought by
Li Luo Biyong and Li Rong
Current Estimated Value
Purchase Details
Closed on
Nov 4, 2016
Sold by
Tung Sau W
Bought by
Conforti Carl J
Purchase Details
Closed on
Oct 25, 2012
Sold by
Tung Sau W and Lam Cheong H
Bought by
Tung Sau W
Purchase Details
Closed on
Dec 20, 2004
Sold by
Tung Sau Wah
Bought by
Lam Cheong Hon and Tung Sau Wah
Purchase Details
Closed on
Feb 20, 2001
Sold by
Friedman Saul J
Bought by
Tung Sau Wah
Home Financials for this Owner
Home Financials are based on the most recent Mortgage that was taken out on this home.
Original Mortgage
$153,000
Interest Rate
7.08%
Mortgage Type
Purchase Money Mortgage
Create a Home Valuation Report for This Property
The Home Valuation Report is an in-depth analysis detailing your home's value as well as a comparison with similar homes in the area
Home Values in the Area
Average Home Value in this Area
Purchase History
| Date | Buyer | Sale Price | Title Company |
|---|---|---|---|
| Li Luo Biyong | $325,000 | -- | |
| Conforti Carl J | $180,000 | -- | |
| Tung Sau W | -- | -- | |
| Lam Cheong Hon | -- | -- | |
| Tung Sau Wah | $170,000 | -- |
Source: Public Records
Mortgage History
| Date | Status | Borrower | Loan Amount |
|---|---|---|---|
| Previous Owner | Tung Sau Wah | $145,000 | |
| Previous Owner | Tung Sau Wah | $153,000 | |
| Previous Owner | Tung Sau Wah | $90,000 |
Source: Public Records
Tax History Compared to Growth
Tax History
| Year | Tax Paid | Tax Assessment Tax Assessment Total Assessment is a certain percentage of the fair market value that is determined by local assessors to be the total taxable value of land and additions on the property. | Land | Improvement |
|---|---|---|---|---|
| 2025 | $3,826 | $422,800 | $128,200 | $294,600 |
| 2024 | $3,455 | $378,000 | $128,200 | $249,800 |
| 2023 | $3,472 | $358,300 | $128,200 | $230,100 |
| 2022 | $3,383 | $326,500 | $128,200 | $198,300 |
| 2021 | $3,283 | $303,100 | $124,500 | $178,600 |
| 2020 | $3,125 | $287,200 | $123,300 | $163,900 |
| 2019 | $3,036 | $279,800 | $118,300 | $161,500 |
| 2018 | $2,764 | $275,800 | $136,900 | $138,900 |
| 2017 | $2,908 | $273,300 | $141,300 | $132,000 |
| 2016 | $2,694 | $254,600 | $116,800 | $137,800 |
| 2015 | $2,612 | $248,500 | $109,100 | $139,400 |
| 2014 | $2,530 | $242,300 | $106,200 | $136,100 |
Source: Public Records
Map
Nearby Homes
- 65 Cross Rd
- 53 Morton Ave
- 310 Old Westport Rd
- 312 Old Westport Rd
- 320 Old Westport Rd
- 28 Greystone Ave
- Lot 6 Rafael Rd
- 135 Old Westport Rd
- 117 Old Westport Rd
- 46 Old Westport Rd
- 4 Sabrinas Way
- 0 Undisclosed Unit 73376281
- 4 Sabrina Way Unit A
- 4 Sabrina Way Unit C
- 4 Sabrina Way Unit B
- 4 Sabrina Way Unit D
- 0 Mosher Ln Unit 73370974
- 219 Chase Rd
- 1406 Tucker Rd
- 368 Cross Rd